RecessionALERT informs you in advance of the risks & probability of a U.S recession and couples this with U.S stock market asset allocation and market-timing models. We do this through various weekly and monthly PDF reports, live timing model and charts heads-up-displays, as well as insightful subscriber-only research from our RESEARCH section. In addition to regular posts to our COMMENTARY blog, subscribers receive regular emailed market commentary direct from our analysts and research team.
Citations
Our approaches have caught the attention of well-followed financial blogger Jeff Miller, widely followed hedge fund manager John Hussman, and the highly popular blogger Dshort.com

Report publishing schedules
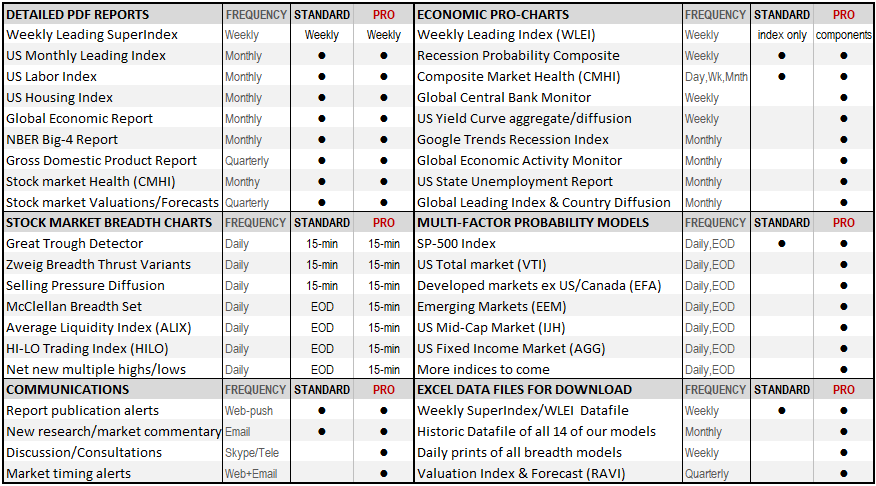
We have an “all-you-can eat” collection of 2 weekly, 7 monthly and 1 quarterly report for a total of 16 reports per month. We also offer a host of robust market-timing algorithms for investors and traders alike that are updated in real-time on our CHARTS menu. All this is offered for a single $425 per year, or $42 per month subscription. Recent report samples can be downloaded below (no obligation, no emails required).
0.Subscription Options.
The $699 PRO Subscription includes a host of extra options over the STANDARD $425 subscription, including PRO Charts. There is a $199 DISCOVERY subscription (discounted STANDARD subscription) for private investors – go to the SUBSCRIBE menu to see if you qualify.
1. U.S Stock Market Timing
We offer a unique blend of traditional econometrics coupled with stock market timing methodology to assist traders, private investors and fund managers to outperform the market on an absolute and risk adjusted returns basis. The current U.S market timing methodologies we offer are discussed in this Market Timing Summary. Our timing models target the six largest investable U.S Exchange Traded Fund (ETF) categories by assets under management (AUM) as depicted below, for a total of 50.1% coverage of the total U.S ETF market by AUM:

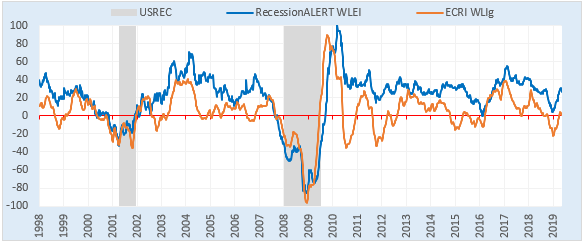
2. Weekly Leading Economic Index (WLEI) [Every Monday]
This is an index constructed purely out of 12 weekly released non-revisable data series and is therefore our highest frequency read on the U.S economy. The only known viable alternative is the ECRI WLI which is subject to many false positives. The WLEI is constructed from 1970 and a more recent comparison of the two weekly indices are shown below as at 17 April 2019. To our knowledge the WLEI is the only available US weekly index that suffered no false positives since 1997, versus the ECRI’s 10 false positives:
3. Weekly SuperIndex Report [Every Monday, sample report up to 19 Feb 2016]
The SuperIndex is a collection of diversified recession forecasting methodologies that differ in data, approach and theory to offer us an over-arching recession dating, forecasting and asset-allocation approach that is resilient to “model risk”. There is no “one size fits all” model that performs well in the past and is guaranteed to perform well into the future. Every recession is different. Since recession calls are “high stakes” events, with costly consequences for either calling a recession when there is none (as with the 2012 ECRI call that cost investors who heeded it 38% in lost stock market gains) or failing to call a recession and getting caught in the average 30% recessionary draw-down, we need to be very sure when we make a call. The only way to do that is by consulting multiple robust models that are not too correlated with each other in make-up or methodology. The SuperIndex allows you to manage a delicate balancing act between early warning and accuracy. This index is published weekly as various of its weekly, monthly and quarterly components are updated. It is thus a pseudo-weekly index and is the 2nd most popular report among our institutional clients.

4. U.S Monthly Leading Economic Index [3rd week of each month, sample report up to March 2019]
The U.S Monthly Leading Index (USMLI) is a U.S economic growth index that has been constructed since 1960 and is a composite of 6 long leading and 17 medium-to-short leading components constructed from over 100 discrete time-series that provides a 6-8 month economic outlook for the U.S. We also show separate long leading (US-LONG) and a short-to-medium leading (US-SHORT) composites. The high number of components used make the USMLI one of the most comprehensive US leading indexes published today. This is our most popular monthly download among institutional clients.

5. U.S Residential Housing Market Index [Last week of each month, sample report up to March 2019]
According to market watchers, there is no better barometer on the health of the U.S. economy than residential housing. So it’s not surprising the Federal Reserve closely monitors housing trends in the course of setting monetary policy. Sound economic growth in the U.S. is not possible without a robust residential real-estate market and in fact 7 of the last 11 declines in the residential housing market has led to economic recession. Also with 11 U.S recessions since the end of World War II, all but two were preceded by a big decline in the residential housing market. Even though housing does not account for all that much of the economy, its role in recessions is huge, because it is highly cyclical and sensitive to interest rates. Housing has never accounted for more than 7 percent of total US GDP, but it has on average accounted for about a quarter of the weakness in recessions since World War II. Our comprehensive housing market report covers 8 major components in an index that provides better lead times to recession than the yield curve.

6. Global Economic Report [1st week of each month, sample report up to February 2019]
This offers a global view to our clients as part of our overall U.S Recession determination efforts. The U.S economy is not an island in this global economy and the economic health of other countries have an impact on the U.S one way or another. This innovative visual report was developed in conjunction with various global Fund Managers to offer “at a glance” views of what is happening with any economy anywhere in the globe and looks at up to 80 countries’ GDP, Leading Economic Indicators (LEI’s) and Import/Export volumes. Most of our clients agree that the yearly subscription is worth this single report alone.

7. NBER Recession Model Report [3rd week of each month, sample report up to March 2019]
This model uses the exact coincident monthly economic indicators deployed by the National Bureau for Economic Research (NBER) for their recession dating determinations. It provides recession dating some 8 months before the NBER official proclamations. It is not part of our RFE, but is an outside “reference of last resort” to determine if we are already in recession or not. The model is highly resilient to revisions and data mining as shown by our detailed research note titled “The NBER co-incident Recession Model – “confirmation of last resort”

8. NBER Gross Domestic Product (GDP) & Income (GDI) Report [Quarterly, sample report up to 4Q2018]
It is clear when reading various pronouncements made by the NBER Business Cycle Dating Committee that the two broadest measures of economic activity, real Gross Domestic Product (real GDP) and real Gross Domestic Income (real GDI) are very important in their determinations. This recession probability model examines the quarterly economic indicators examined by the NBER for their recession dating determinations. It is not part of our RFE, but is an outside “reference of last resort” to determine if we are already in recession or not. This report, coupled with the previous report, serve as a comprehensive view on all data the NBER will be examining in proclaiming recession. A detailed research note “Estimating Recession probabilities with GDP & GDI” explains the theory and graphic examples of how well this model works.

9. Labor Market Report [1st week of every month, sample report up to March 2019]
The Labor Market Growth Index (LMGI) groups together in a weighted composite, six labor-market related measurements , normally within the first Friday falling between 5th-11th of the month. Each of the six indicators chosen have been found to be reliable in describing & predicting turning points in the U.S economic cycle as defined by the NBER. The LMGI also serves as an authoritative, broad, at-a-glance representation on general U.S labor market conditions. One of the major advantages of the LMGI is that all six of its components are published right at the beginning of each month, giving us a much earlier comprehensive view of the U.S economy than other composite indicators that are made up of data released throughout the course of a month. Additionally, the FED has made noises recently of tying their interest rate decisions to various labor market components meaning that this is going to be the indicator to watch. Included in the report is the popular Yellen Labor Dashboard that also tracks 9 labor market measurements followed by the FED.

10. Composite U.S Market Health Index – CMHI [last week of each month, sample report up to Mar 2013]
The CMHI measures SP-500 bull-market health through a broad, diverse array of 7 indicators that reliably warn of bear markets. The approach is comprehensively described in our very popular research note titled “Seven paw-prints of the Bear” which was downloaded over 20,000 times since publication. There are three market breadth indicators, two price-action indicators, a composite leading economic indicator and a Seasonality indicator. These are combined into an equally weighted composite signal. The higher the CMHI the more bullish the market and the lower the CMHI the more bearish the market. Generally we want to be in cash when the CMHI is less than zero. A Diffusion is also shown to guide you with stock market exposure. In addition to the monthly report below we also publish the CMHI and all its components daily in our CHARTS menu.

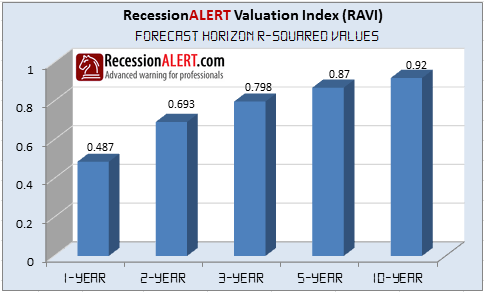
11. Stock Market Valuation model for predicting future returns (RAVI)
Very popular among our investing clients, the RecessionALERT Valuation Index (RAVI) examines 10-year cyclically adjusted trailing SP-500 earnings, the SP-500 index level, total stock market capitalization, Gross Domestic Product, total SP-500 corporate liabilities, total SP-500 corporate net-worth and percentage of investors allocation to stocks versus cash and bonds to determine 10, 5, 3, 2 and 1 year forecasts for the SP-500 Total Return Index (dividends re-invested). The remarkable historical accuracy of the various forecast horizons since 1970 are shown below:
12. Historical Data Analysis Tool
This allows you to view all major recession models we maintain in a side-by-side fashion during each expansion and recession. This allows detailed inspection of the co-movement of our various short-leading, long-leading and co-incident recession models. In addition, clients can select their favorite RecessionALERT quantitative models and combine them together into a custom composite and view the behavior of the composite and its components over time. This allows financial advisers and brokerage firms to custom-build robust recession models unique to their practice or brand for input into the overall quantitative process used by them to manage their clients affairs. All data can be imported into your own quantitative models. The Analysis Tool is discussed over here.
13. PRO Subscription
The $699 PRO subscription is all of the above PLUS three phone consultations to explain model use & interpretation or to expand on market alerts, commentary or research. PLUS weekly & monthly Excel history files of econometric models with associated diffusions & vintages. PLUS emailed alerts & exclusive research. PLUS Pro Charts.
STANDARD SUBSCRIPTION OPTIONS
Subscriptions are US$425 per year once-off upfront payment or $42 per-month (cancel any time) for access to ALL the above reports, that are published 17 times per month. Reports are all in PDF format and archived in real-time in the members download section of the web site. Each report is time-stamped and there are also individual tabs to view archives of specific report types.