
Those clients who have been with us since 2010 will know our refrain from issuing unnecessary and/or sensationalist warnings about the economy and markets. In fact, in 2012, the general consensus was that the US economy was about to fall back into recession, a view we opposed to quite some ridicule from certain quarters.
Whilst we see no immediate danger signals from the econometric models (apart from the narrowing yield curves in the bond market) we do see danger posed by current stock market valuations. Now stock market valuations have been touted as offering “clear and present danger” for the last 3 years running from several quarters except ours, so this is the first time this business cycle we are joining that clarion call. But using different models we might add.
Our model of choice when measuring risks (or opportunities) posed by US stock market valuations is the RecessionALERT Valuation Index (RAVI) which you can read about over here. The RAVI data for 3Q2018 has just been updated and is available in the CHARTS>MACRO>RAVI tab where you can review and verify the information we provide below.
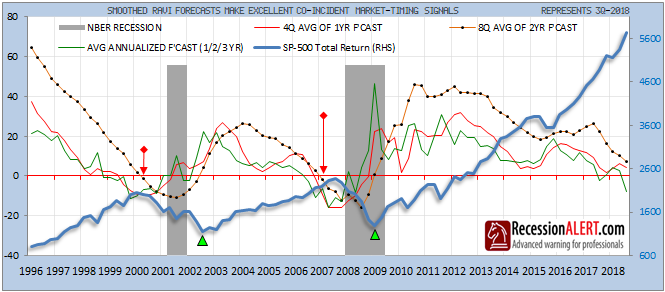
Our main tools with the RAVI to assess long-leading stock market peak warnings are:
- The 4-quarter average of the 1-year SP500 forecast,
- The average annualized forecast from the 1, 2 and 3 year forecast models
- The 8-quarter average of the 2-year SP500 forecast.
These are shown below, where it is evident why we are sounding the alarm on valuations:
The RAVI 1-year (3Q18 to 3Q19) and 2-year (3Q18 to 3Q20) forecast for the SP500 are depicted below:
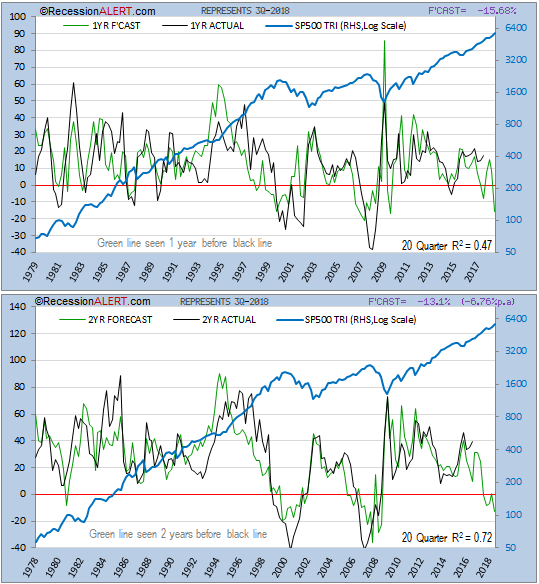
Whilst the r-squared values are very respectable for such short-run forecasting models, it is the act of the forecasts turning negative that is of more interest, since these foretold the last two recessions and subsequent stock market crashes. Both are firmly in the red.
Given that the models run 1-quarter in arrears, and the SP500 Total Return actually topped in 3Q18, it is quite feasible that we have witnessed the stock market top already. But if not, it just means that the valuations become even more stretched in 4Q2018 – a situation that could persist for up to a several quarters (or not). One thing we cannot deny though – the business cycle is clearly in the sunset stages.
There is one big “yes, but…” with these models. We only have an accurate track record of two recessions, whilst all our other econometric models have at least 6 , sometimes 10 on their track records.
What makes this model a particularly interesting addition to our arsenal though is that it is completely different to all the others and is the only metric we have that looks at valuations themselves as a trigger for recession.
In summary, a stock market correction is more likely to be triggered by overvaluations at this point in time than by concerns about the economy. Caution is advised.
Comments are closed.