
There is naturally a lot of focus on the U.S yield-curve at the moment, as it moves relentlessly toward inversion (when short-term rates are higher than long-term rates.) Can the history of the yield-curve inversion provide for useful forecasting as to the start dates of the next U.S recession?
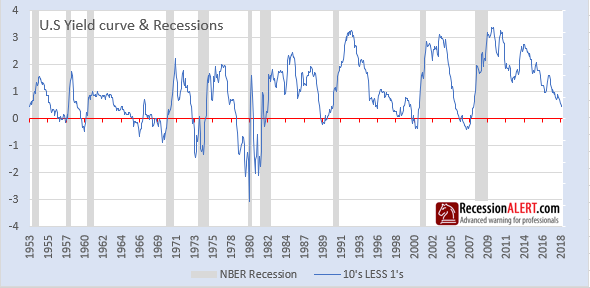
The 10’s vs. 1’s yield-curve and U.S recessions in the post-war era are displayed below, where it is clear that the nine recessions since 1956 were predicted by yield-curve inversion, with one false positive in 1966.:
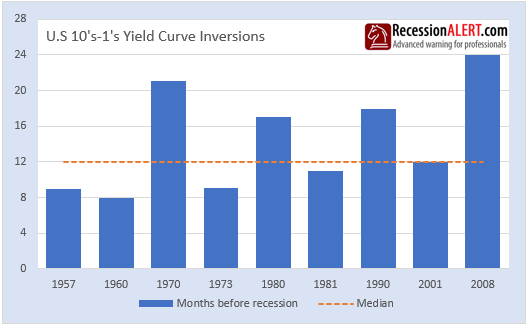
The chart below shows how many months the yield-curve inverted before each of the recessions. We ignored the false positive in 1966 to give the yield-curve the benefit of the doubt. The smallest lead-times to recession average 8 months, the median lead-time is 12 months and the longest lead-times average 20 months:
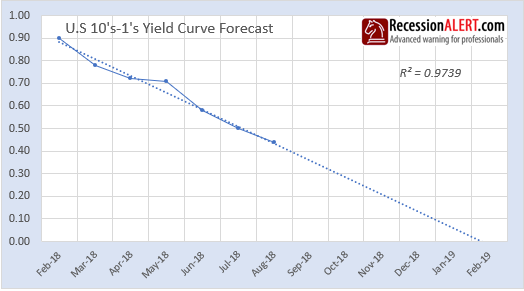
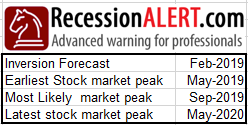
So all that is required now is to project the current yield-curve trajectory into the future to see when it will invert, arriving at a date of February 2019:
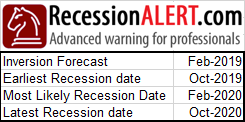
From this projected inversion date we can make some estimates on when we are most likely to see the arrival of a U.S recession based on the average short lead-time, the median lead-time and the average longest lead-time to a recession:
Now it is accepted that the U.S stock market is a forward-looking indicator and will peak before the onset of a recession. Sure enough, in our 2012 research note: “Recession: Just How Much Warning Is Useful Anyway?” we showed that any generalized stock market defensive actions 5 months before the onset of recession are likely to prove unproductive, based on the last 5 recessions. This would imply we need to start preparing for a U.S stock market peak around the following dates:
There is a lot of commentary around the yield-curve no longer being an effective recession warning indicator due to the artificial low-interest rate environment created by the FED. There is also the timeless stock market quip that when you start hearing that “this time is different” that things will turn out anything but different. There are a lot of theories as to why an inverted yield-curve for even short periods will guarantee a recession, but the one that made the most sense to me follows:
“Banks make longer-duration loans to clients who pay the longer term rates. These loans are the assets of the bank. Depositors lend money to the bank at the short-term interest rate. These are the bank’s liabilities. When the bank pays a higher rate on its liabilities than what it earns on its assets, it loses the incentive to forward more loans to businesses and stops lending. This causes a “credit crunch” or the falling availability of credit. Businesses struggle to roll over their current account credit and they are forced to downsize and lay off workers, and we enter a recession. The moment the Fed engineers short-term interest rates to go below long-term interest rates, the banks can generate a profit again, credit expansion will resume and the stock market and economy can recover.”
If one assumes the above narrative to be true, then it doesn’t matter how low the interest rate environment currently engineered by the FED is – when short-term rates are higher than long-term rates a credit crunch, stock market peak, and recession is inevitable.
We can make some interesting observations by measuring the area under the yield-curve when it is above and below zero respectively as depicted below:
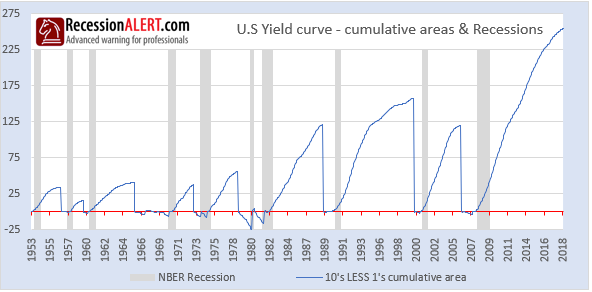
We note that it does not take a lot (as measured by cumulative inversion area below zero) to trigger a credit crunch and recession. We can also deem the area above zero as representing “excess liquidity” and quite clearly the area of the current credit-easing cycle dwarfs all those preceding it. Many believe that the larger the credit easing excess, the worse the subsequent recession, but this is untested by any research we have conducted or come across yet.
Comments are closed.