
The SP500 has put in a 7.4% peak-to-trough correction since 12 October.
In the last 20 years, according to our SP500 probability model, corrections of more than this magnitude have occurred only 11.4% of the time, hinting at a 88.6% probability the worst is over.
The SP500 has also put in lower weekly closes 3 weeks in a row. Additional lower weekly closes have only occurred 15.9% of the time in the past, implying a 84.1% probability the worst is over.
The VIX has jumped to levels only exceeded 8.4% of the time, implying a 91.6% probability the worst is over.
The correction has endured 15 sessions, with longer corrections witnessed only 17% of the time, implying a 83% probability the worst is over.
These 4 measurements imply we are close to having seeing the worst, according to the historical record of price action.
Further conviction for a positive month in November comes from the Seasonality Timing Model (STM) where the Composite Seasonality Score (which examines long-term historical record of monthly gains, positivity rates and gain/loss ratios across 4 different seasonality cycles) is 74.0, just under the extremely bullish threshold that encourages leverage due to high incidence of positive outcomes:
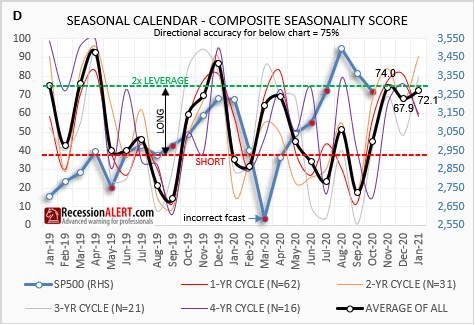
Given the large correction we saw over the last 2 months, this prediction is much more likely to come into play. It is not often we see 2x LEVERAGE levels on the seasonal forecasting models coupled with a prior 2 month or longer correction of 7% or more. In 90% of the cases the seasonal forecasts prove accurate.
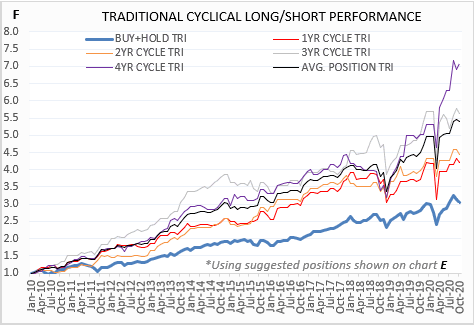
Even if we were concerned about the effects of the current election on outcomes, we can examine the 4-year Presidential Cycle model for cues on this particular Novembers’ performance. This model has been out-performing the 1,2 and 3-year cycles over the last decade:
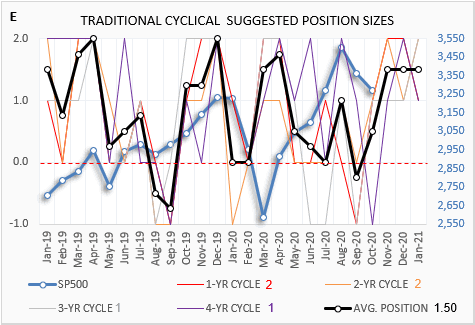
The Presidential Cycle model is bullish for November (1 long position), and even suggests to lever-up in December (2 long positions due the historical 80% win rate for that month):
On the whole, across the 1,2,3 and 4-year seasonal cycles, as well as the composite model, the upcoming 3 months of November, December and January are forecast to be statistically bullish.
The easiest way to cue your market entries, if you are following any (or all) of our 12 market timing models, is to simply examine the SIGS signal composite for the first two or three BUY signals to appear. The bottom signal composite line will jump from -12 (all bearish) to a higher reading as the first models start going bullish:
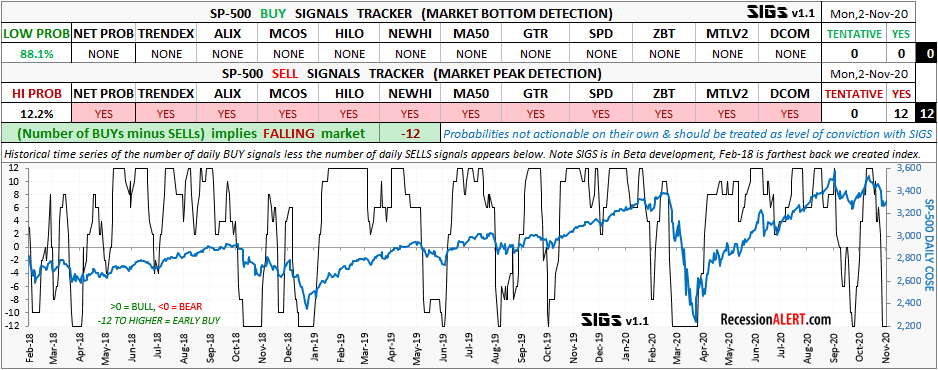
The SIGS composite is available from the “SP500 Signals” tab in the Charts Dashboard.
You can also go and examine further detail for the next 3 months in the Seasonality Timing Model in the “STM” tab in the Monthly Charts menu.
Comments are closed.