
We examined SP-500 behavior in the lead to and during US recessions a few years ago in an old research note (Recession – Just how much warning is useful anyway?) to conclude that more than 5-months warning before a recession was not constructive, and that you should focus on recession warning models that stuck to a 4-6 month historical lead time as close as possible.
Given the “voluntary” sudden-stop of the U.S economy due to Coronavirus lock-downs, we are faced with an “artificial” non-systemic recession that was not caused by the usual financial imbalances, but rather an exogenous event. In such situations, leading economic indicators offer little hope of warning and are currently operating as coincident indicators.
The statistics still offer some useful guidance though, even if we acknowledge we are comparing a non-systemic recession to historical systemic ones. For example, the recent correction delivered a peak-to-trough decline of 33.92% versus the average month-to-month recessionary decline of 30%. However, the recent 23-session correction compares to the historical duration of some 13 months!
We examine the historical behavior of the SP500 around US recessions with seven metrics as shown below, using monthly closes (as opposed to daily closes where draw-downs would be higher):
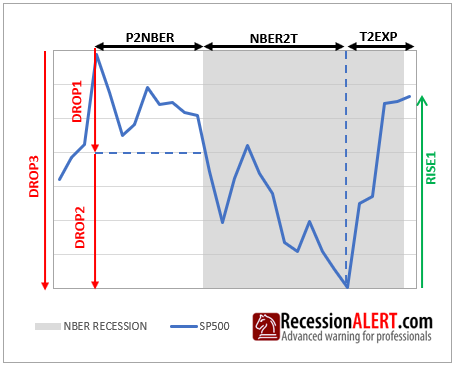
- P2NBER is the amount of months taken from the SP500 peak to the first month of recession.
- DROP1 is the draw-down in the P2NBER period (monthly closes)
- NBER2T is the amount of months from first month of recession to the SP500 trough
- DROP2 is the draw-down in the NBER2T period. (monthly closes)
- DROP3 is the total peak to trough draw-down experienced. (monthly closes)
- T2EXP is the months from SP500 trough to the first month of expansion.
- RISE1 is the size of the rally from the SP500 trough to the first month of expansion.
The metrics appear below in tabular form:
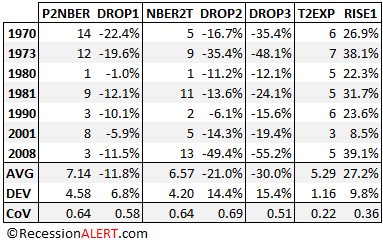
We conclude, on average, that the SP500 peaks some 7 months (AVG) before onset of recession, but with a wide standard deviation (DEV) of 4.58 months. This means the stock market can peak anywhere from 2.6 to 11.72 months before recession. Total declines average 30% but again with a wide 15.4% standard deviation meaning any draw-down of 14.6% to 45.4% is statistically possible.
The statistics for the post-trough metrics have far less variances though. If we take the standard deviation and divide it by the average we get a Coefficient of Variance (CoV) which is a dispersion metric. The statistical dispersion for the post-trough metrics are far less than those of the pre-trough metrics, as you can see in the last row of the above table.
The SP500 troughs some 5.29 months before the first post-recession expansionary month, with a small 1.16 month standard deviation. This means the stock market can trough anywhere from 4.13 to 6.45 months months before the economy resumes expansion again.
We can do a fun exercise with these low dispersion metrics. If we deem the 23rd March 2020 SP500 low of 2,237 as the ultimate trough for this business cycle, then we could expect to emerge from this recession anywhere between July 2020 and September 2020 (averaged at August 2020), with SP500 trough-to-peak gains of 17.4% to 37% (averaged at 27.2%) This gives us SP500 targets of 2,626 to 3,064 (averaged at 2,845.)
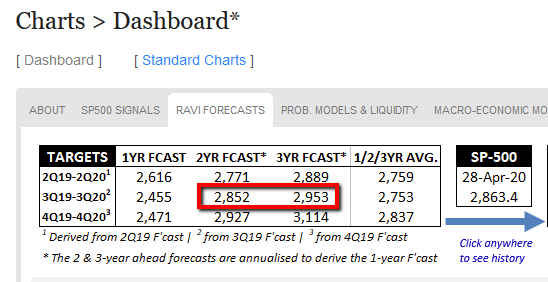
Interestingly enough, these figures are not too far off the RAVI 3Q2020 forecasts as shown below, meaning such a rally would theoretically remain within “sane valuations” territory. Unfortunately, we have already rallied close to this point, meaning any small term pullback would be welcome. However, with the market following the “FED put” and unprecedented quantitative easing ( economy and Cornavirus be damned) we should not be surprised to see the market rally way beyond 3,000 in the near future.
We will soon see if the WLEI2, SuperIndex and USMLEI leading indicators trough around the July/August time-frame to confirm the above assumptions.
Comments are closed.