
The RecessionALERT Valuation Index (RAVI) is currently forecasting 30% growth for 2016 for the SP500 with its 1-year forecast model. “How the heck is this possible given current overvaluation of the market?” we can hear you say. Let us show you how this is calculated so we can put the forecast into context:
Firstly, we know we have a very accurate 10-year forecast model with the RAVI:
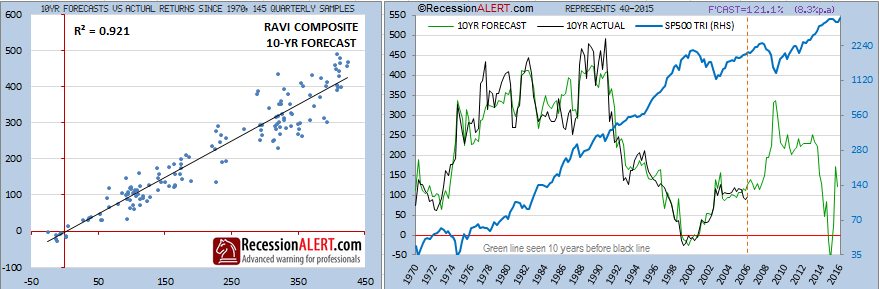
We can see that 10-year forecasts for the SP500 Total Return Index (including re-invested dividends) has a correlation of 0.92 to actual achievements. This is aptly shown by the chart on the right which plots the forecast (green line) and the actual achieved 10-year return (black line). Its important to note that the green line is seen 10-years before the black line!
The 10-year model is currently forecasting 121% growth from Dec 2015 to Dec 2025 or approximately 8.3% compound growth per annum. So one way we can forecast returns for the year ahead is to say that we are projected to grow 8.3% compound per annum so that means we can pencil in 8.3% growth for 2016. But this is a very broad brushstroke since we all know the market is highly unlikely to grow steadily by this amount for 10 years in a row.
The other way is to look at what the 10-year forecast was 9-years ago and then compare this to the actual growth we have achieved in the last 9 years and from this we should be able to work out how much upside is still left in the year ahead to make the 10-year forecast made 9 years ago true. In fact we can apply this logic to any look-ahead horizon:
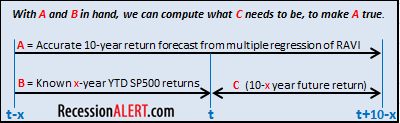
Using the above table, if we set x to 9 we get the procedure used to forecast 1-year ahead returns. Similarly, setting x to 8 we can impute 2-year ahead returns.
This is the exact methodology used by RAVI to compute 1,2,3 and 5 year SP500 forecasts and it works exceedingly well as shown below, with better results achieved over longer term horizons:
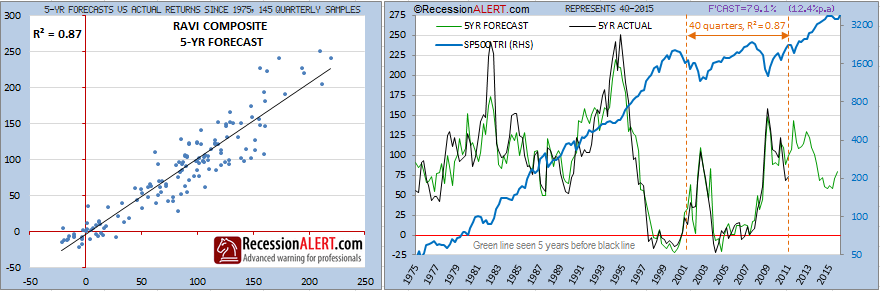
Before we go ahead, let us just state that a correlation coefficient of 0.48 for a model forecasting 1-year ahead stock market returns is absolutely amazing, especially when considering that direct correlations between most commonly-used valuation metrics and 1-year Sp500 returns range from 0.1 to 0.15. But as you can see from the 1st chart above on the right, even this model can vary quite significantly from quarter to quarter (look at the vertical distances achieved between the green line and the black line). So you have to understand that these 1-year forecasts are rough guidelines and an achievement of 10% gains against a forecast of 30% gains is still “within target” of the model.
So let’s go through the logic in a real world, current example. At the end of December 2006, the RAVI model was forecasting 113.35% growth for the next 10 years to December 2016. As at the end of December 2015 the SP500 Total Return Index had grown 63.3% since this forecast was made. Using a mathematical formula we can thus deduce there must still be 30.6% upside left in the SP500 to bring the 10-year growth to 113.35%
The conclusion therefore, using this model, is that the stock market has not yet run way ahead of itself – contrary to what most people are trying to make you think.
The reason most people think the market has run ahead of itself is that everyone keeps trotting out valuation metrics like Shillers’ 10-year CAPE, Tobins’-Q, Market-Cap to GDP (Buffet Indicator) and so forth and these all look more or less the same and the messages being imparted are all more or less the same – the valuation metrics are at all time highs or way above long-run averages and therefore 10-year future returns are going to be poor and the market is in a dangerous period:
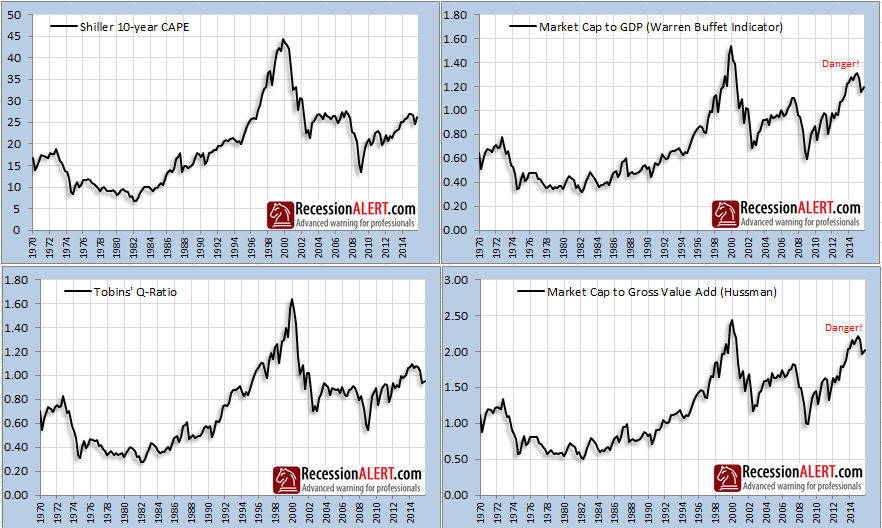
The fact of the matter is that these valuation metrics all have very little bearing on short-run returns and what is more important is:
1). What they were saying nine years ago and
2). How much the stock market has run since then.
This does not detract from the fact that the metrics are way above their long-run averages – they clearly are. But this is creating a problem for 10 years time, and not now.
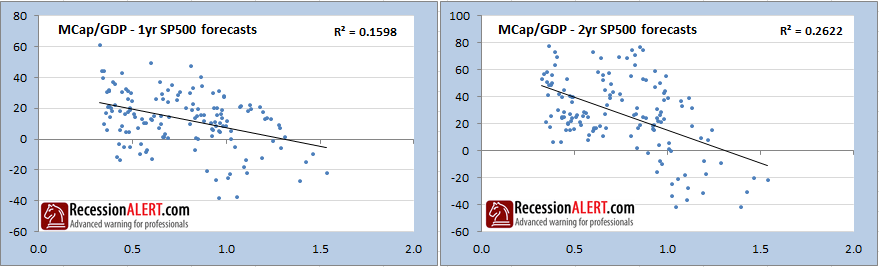
Below is the best short-run correlation we could find directly from all the valuation metrics, obtained with the Market Cap to GDP ratio. As you can see, the correlation provided from using the metric directly is far short of the 0.48 achieved with the RAVI using the “look-back” methodology we described in this note.
Nonetheless, we now have several estimations we can use for 2016 returns for the SP500:
a). 8.3% if we annualize the 10-year forecast (2,213 target)
b). 12.4% if we annualize the 5-year RAVI forecast (2,297 target) <-most likely scenario
c). 20.7% if we annualize the 3-year RAVI forecast (2,467 target)
d). 27% if we annualize the 2-year RAVI forecast (2,595 target)
e). 30.6% if we use the 1-year RAVI forecast (2,669 target)
We tend to ignore the 1-year RAVI (due to its wide fluctuations) and use the low, average and high from (b),(c) and (d) above for 2016 targets on our daily updated dashboard:
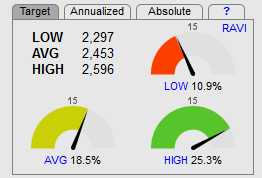
Bear in mind that the 3 radial gauges change on a daily basis depending on the current level of the SP-500 and how far it needs to go to reach the LOW,AVG and HIGH targets.
Comments are closed.