
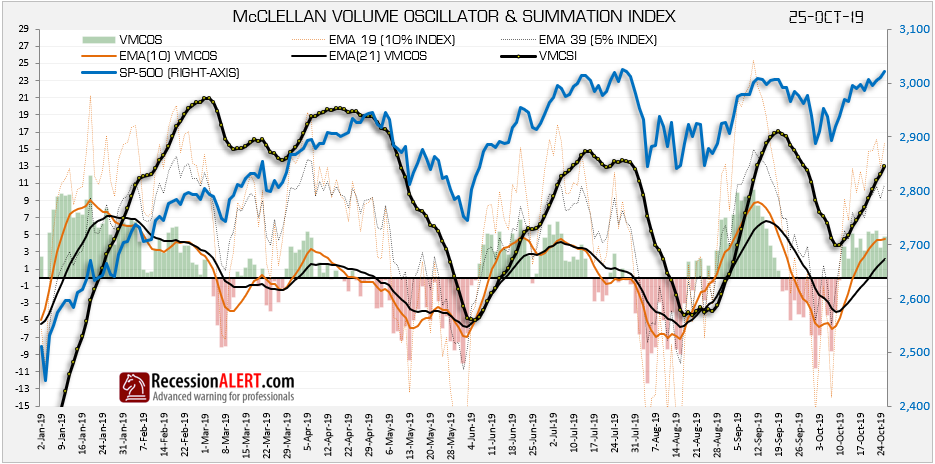
This is a complete short, medium and long-term stock market liquidity risk-management tool derived from the McClellan Oscillator methodology applied to daily advancing and declining volume on the SP-500. It has been depicted as a daily updated chart for standard subscriptions for over 7 years now.
Each day, we compute daily advancing volume (sum of volume traded of all shares that rose in price) less daily declining volume to get daily net advancing volume. This is very volatile and unusable in raw form, so we calculate as per the McClellan methodology, a 19-period exponentially smoothed (10% index) and 39-period exponentially smoothed (5% index) of the daily net advancing volume. The difference between the 10% index and the 5% index is known as the Volume McClellan Oscillator (VMCOS) shown on our chart as green and red shaded vertical bars.
We also show a 10-period “EMA(10) VMCOS” and a 21-period “EMA(21) VMCOS” exponential smoothing of the VMCOS on the chart. Finally, the McClellan Volume Summation Index (VMCSI) is shown as a thick black line, which is merely the previous days’ VMCSI plus today’s VMCOS. Thus, when VMCOS is negative (red bars), the VMCSI will fall and when VMCOS is positive (green bar), VMCSI will rise.
A typical daily updated chart with the McClellan breadth indicators described above is depicted below:
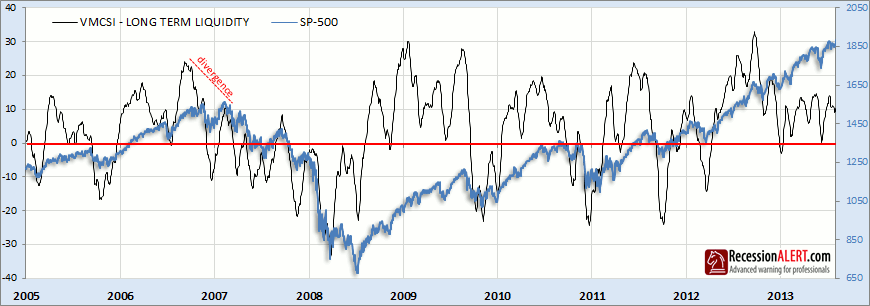
The VMCSI is a representation of longer-term liquidity flows:
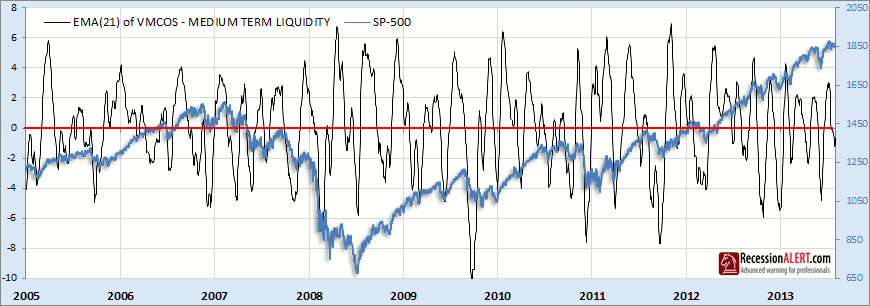
The 10 and 21-period exponentially smoothed versions of VMCOS are both designed to give a medium-term interpretation to liquidity flows, and we show the 21-period smoothed below as an example, since we considered it to be the best representation of medium-term liquidity out of the two. When this indicator drops below zero you have a good warning of a coming market correction:
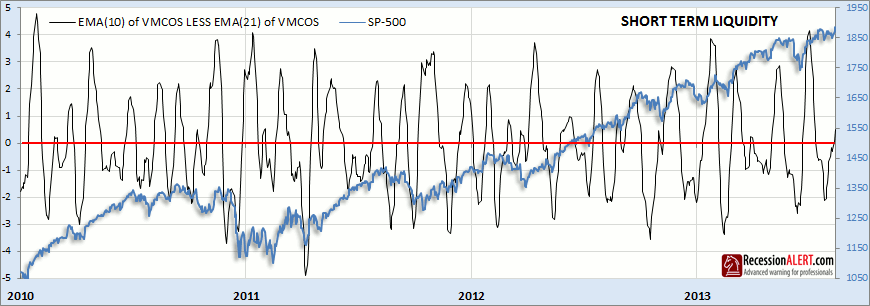
The EMA(10) of VMCOS less the EMA(21) of VMCOS is a representation of short-term liquidity flows and is dubbed Short Term Liquidity (STL). When the 10-period smoothed of VMCOS falls below the 21-period smoothed of VMCOS this gives excellent early warning of market corrections. STL is far more useful as a short-term liquidity risk measurement tool than the daily raw VMCOS or any smoothed VMCOS variant, since it gives earlier warning of corrections and is far less volatile (less whipsaws). STL is a powerful indicator and is included as one of the four components of the Average Liquidity Index (ALIX – see separate research note) and its behavior over the last 5 years is shown below:
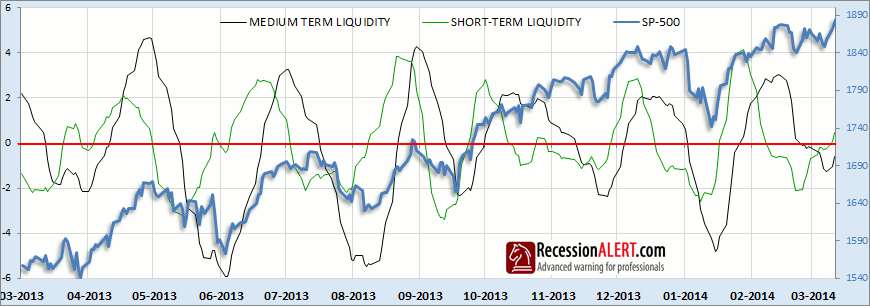
As one would expect, short term liquidity leads medium term liquidity which leads long-term liquidity as shown below. Note the excellent early-warnings of corrections given by STL (the green line) when it dips below zero. The STL is an excellent short term market timing tool. The idea is you buy the SP-500 when it rises above zero and sell again when it falls below zero.
Other important things to note from the daily chart is that when VMCOS is negative, but both the 5% and 10% indexes are still positive then this has less negative connotations than when either of the 5% or 10% indexes are below zero. Similarly, when short or medium term liquidity is below zero this has far less negative connotations when the MCSI (long term liquidity) is above zero.
A typical sequence of escalating alerts to worsening market liquidity conditions will in most cases (not all) proceed as follows:
- EMA(10) of VMCOS drops below EMA(21) of VMCOS (STL drops below zero)
- VMCOS drops below zero
- EMA(10) of VMCOS drops below zero
- 10% IDX drops below zero
- EMA(21) of VMCOS (MTL) drops below zero
- 5%IDX drops below zero
- VMCSI (long-term liquidity) drops below zero
Comments are closed.