
The Average Liquidity Index (ALIX) has been published daily for our clients for over 5 years. This document serves as a brief overview.
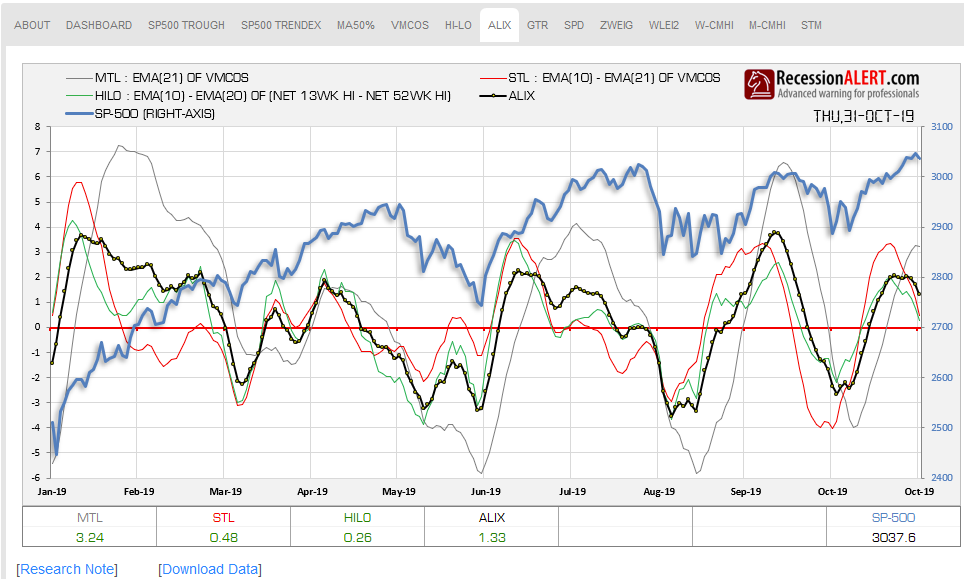
ALIX is the average of the medium-term liquidity index from the VMCOS chart (EMA(21) of VMCOS), the short-term liquidity index from the VMCOS chart (EMA(10) less EMA(21) of VMCOS) and the short-term liquidity index derived from the HILO chart (EMA(10) less EMA(20) of Net 13wk less Net 52Wk highs).
It is designed to gauge short-term market liquidity risk and is especially useful to market timers of the SP-500 index.
- The thin grey line is the Medium-term liquidity index “21EMA” displayed in the MCOS chart.
- The red thin line is the Short-term liquidity index from the MCOS chart and represents the difference between the “10EMA” line and the “21EMA” line displayed on the chart.
- The thin green line is another innovative representation of short-term liquidity flows discussed in our “Hi-Lo Breadth Indexes for the SP-500” research note, and is the difference between the “HiLo Fast” and “HiLo Breadth” indexes displayed on your HILO chart.
- The thick black line above is merely the aggregate of the Medium-term liquidity index and the two short-term liquidity indexes, which we have chosen to dub the “Average Liquidity Index” or ALIX for short.
In many ways, the ALIX is more useful for market timing or risk assessment purposes than any of its individual components, since it brings together the early-warnings of market tops provided by the short-term liquidity indexes coupled with the low whipsaw-rate of the Medium-term liquidity index. As you can see from the above chart, it is very closely tuned into the SP-500 market cycles.
Going back to 1990, the synchronization of the ALIX to the cyclical fluctuations of the SP-500 have varied from “strong” to the “very strong” relationship it has now displayed for the last 3 years. For this reason, we must enjoy the current strong relationship and the predictability it provides for the SP-500 movements but always bear in mind the relationship may weaken at any time. Our research has revealed that the stronger relationships usually manifest when high selectivity is in play on the stock market (when fewer shares than normal are contributing to the SP-500 gains), which of course is a characteristic of bull markets entering their late mature phases.
When the short term liquidity indexes drop below zero, this is normally an excellent forewarning of trouble to come, especially if both of them fall below zero. More often than not, the ALIX will follow suit (since the short term indexes are leading indicators for the ALIX), after which it is a near certainty that the medium-term liquidity index will also drop below zero. You can thus expect the following sequence of escalating warnings for a SP-500 correction:
- One of the short term liquidity indexes will drop below zero
- The remaining short-term liquidity index will drop below zero
- The ALIX will drop below zero
- The medium-term liquidity index will drop below zero
The ALIX is merely the representation of liquidity risk derived from measuring market breadth. It is no guarantee that the stock market will plunge further when it drops below zero. Likely, yes, but a certainty, no. However should the ALIX drop below zero, at the very least, the SP-500 will experience a rise in volatility and engage in some sideways movement before resuming an upward march. There may be instances where the ALI gets you out the market and the market resumes its rally, but these rare inefficiencies are merely a form of “insurance” against volatility and nasty bear market downturns.
The daily ALIX prints are available in the charts menu for subscribers as shown below:
As with most of our market breadth charts, you can click on the chart to view a longer-term view image, or you can download the 20-years historical data of ALIX and all the components in Excel from the [Download Data] link at the bottom of the chart.
Comments are closed.