
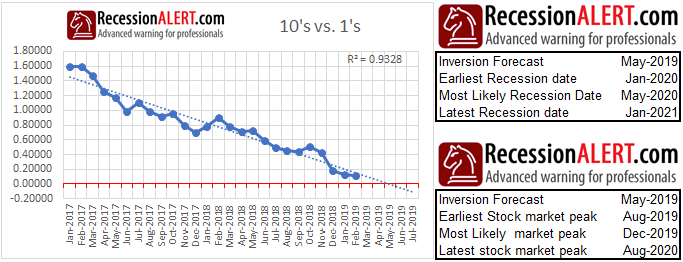
In our February 2019 commentary we forecast that the 10’s and 1’s yield-curve would invert in May. The data below is taken from that market commentary, with a warning that the indicated dates of recession have a very wide standard deviation over the historical record:
The 10’s and 1’s term spread has been inverted since 23rd May, for six sessions now. The question that naturally comes to mind is “how long must the daily yield curve be inverted for us to have a “latch“?”
The chart below shows daily 10’s less 1’s yield curve prints since 1962:

Apart from brief 1-day inversions on 21/09/1998 and 05/10/1998 there have been no inversion spells that have not ultimately led to full-blown sustained inversion very shortly thereafter. Our preferred granularity is on the weekly level, which at six days inversion has now been met.
Assuming prior daily history holds, one would be inclined to assume the 10’s and 1’s yield-curve will remain inverted or if not, will remain inverted in the very near future.
However, in a past commentary we observed that once more than 60% of the treasury yield-curve spectrum inverts, the remainder invariably all invert in very short order. It is probably more useful to examine the entire treasury term-spread spectrum to try and assess where we are:

At this point in time we are bouncing on that 60% level with just the 10’s and 2’s, the 10’s and 3’s, the 10’s and 5’s and the 5’s and 3’s (the traditional inversion laggards) above water:

And herein lies a clue as to why this time things may be different – the ones above water and some of those already below water are actually widening their spreads! This could quite well shape up to be a false positive as witnessed in 1999 when only 60% of the treasury spectrum inverted.
The longer the 10’s and 1’s (and all the others that currently are inverted) remain below zero, the higher the odds of a sustained inversion but for now we are still 40% short of a full spectrum treasury term-spread inversion.
There is of course one more question we need to start answering and that is assuming the yield curve remains inverted or does so in short order, will this lead to recession? There are two camps at the moment:
- Those that ridicule the “this time is different” arguments, noting that every time in the past things we proclaimed different they were anything but;
- Those that argue that the negative real interest rate policy of the Fed and other forces causing today’s inverted yield curve are entirely different from those in the past.
We have seen some pretty compelling arguments from the “this time is different” yield-curve camp and of course there have been prior inversions that have NOT led to recession (see 1966) and we will therefore be observing many other long-leading indicators less influenced by the Fed and artificially low interest rates to come to our determinations. Any recovery in the residential housing market index (USHMI) should be watched as well as the current situation of all the other long leading indicators in the Monthly Leading Economic Index (USMLI).
Conclusion : A definite yellow flag for the treasury yield curve spectrum is up, but given only a 60% inversion, we do not think the red flag for the full yield curve spectrum is up yet.
Comments are closed.