
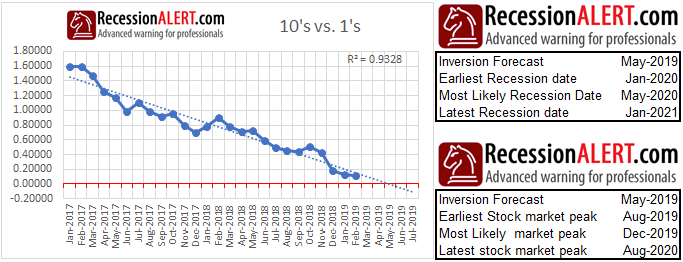
Based on the methodology discussed here we hereby update our U.S Yield-curve inversion forecast and subsequent recession and stock market peak forecasts. All the forecast dates have moved foward by 1 month as the yield curve continues to print below its regression mean:
As a matter of interest, 60% of all 10 possible term-spreads have now inverted, as shown below with our average yield curve composite of all 10 term-spreads:

We have inversions on all the typical early inverters:
- 5’s and 3’s,
- 5’s and 2’s,
- 5’s and 1’s,
- 3’s and 2’s
- 3’s and 1’s
- 2’s and 1’s.
What is of interest is that once the yield curve complex starts inverting, invariably all of them land up inverting, bar one case in 1999.
Whilst there is currently high interest in the yield-curve for predicting or forecasting recessions, remember that it is a single long-leading indicator with significant variances in lead times to historical recession which makes it far less useful to the market-timer than meets the eye. These rough guidelines in the tables above are provided to highlight these wide variances and assist you to guage the major inflection points to watch.
Comments are closed.