
Magnitude of a Recession.
Composition of a Recovery. One Honest Gauge.
The most reliable recession indicator in modern macroeconomics tripped in the summer of 2024, and no recession came. The rule did not break. It reads only the magnitude of a rise in unemployment, never its composition — and this cycle, for the first time in fifty-seven years, half the rise was not job loss at all. It was labour supply: an immigration surge the rule could not tell apart from decline. Every version of the gauge screamed except one. That one was right.
- How can the most reliable recession indicator in modern macroeconomics fire — and be wrong?
- How can one rule read 0.10 and 0.90 on the very same data, in the same month?
- Out of a whole family of variants, why did exactly one read the cycle right?
The most reliable recession indicator in modern macroeconomics went off in the summer of 2024 — and the recession never came. The Sahm rule, which signals a downturn when the three-month average of the unemployment rate rises half a percentage point above its trailing-twelve-month low, tripped in July 2024 at a reading of 0.53. On the standard measure it had never produced a false positive in more than fifty years. The market panic that followed — the one that took the Nikkei down twenty percent in three sessions, its worst run since 1987 — cited the trigger by name. Then the economy declined to cooperate. Unemployment climbed to 4.3 percent and settled into a narrow 4.3-to-4.5 band; GDP kept expanding; and the National Bureau of Economic Research, the official arbiter of U.S. recessions, has to this day dated nothing.
That is the first puzzle. The second is stranger. What Claudia Sahm published was a single rule — the one above. But the idea proved fertile, and a family of variants has grown up around it, separated by two choices: which unemployment series you measure, and how far back you look for the low you measure against. Some anchor to the cycle low rather than a rolling twelve months; others swap the headline rate for a narrower count. We catalogued that full family — Sahm’s original alongside the later variants, their construction, history, and track records — in The SAHM Rule Redux two years ago, and closed that study by singling out one member, built on a narrower count that captures only the workers who have actually lost a job, as the most robust of the group. This cycle, with the rest of the family in disarray, it is the one that held. This note takes that groundwork as given and asks a different question: not which variant is most accurate, but why, this cycle, they stopped agreeing.
Plot them together today and they no longer do. One version reads 0.90 — deep in recession territory. Another reads 0.10 — as if nothing happened at all. Same labour market, same month, the same underlying rule, and a ninefold gap in the verdict. Widen the lens from the national number to the state and metro level and the disagreement only compounds: at the 2024 peak, a majority of individual states and a clear majority of metro areas had each tripped their own version of the rule, even as the smoothed national figure barely cleared its trigger.
So the questions arrange themselves. Why did an indicator with a spotless record fire without a recession? Why do its own variants disagree by an order of magnitude on identical data? Why is the broadest, most geographically complete reading screaming while the headline number whispers? And — the question an investor actually has to answer — if the alarm was wrong this time, is it wrong in the direction of safety, or is something real hiding underneath it?
The answer to all of these is the same, and it is not that the rule is broken. The rule is doing exactly what it was built to do; it was simply built to measure one thing, and this cycle produced another. The Sahm rule reads the magnitude of a rise in unemployment. It is blind to the composition of that rise. For seventy years the two moved together — unemployment rose because people were losing jobs, so the size of the move was as good as a reading of its cause. This is the first cycle in which they came apart. The rate rose like a recession. What sat underneath it looked like something else entirely.
A recession rule can only see how far unemployment has risen — never why. This cycle, half the rise was not job loss at all. That single fact explains the false alarm, the disagreement between every version of the rule, and the one version that got it right.
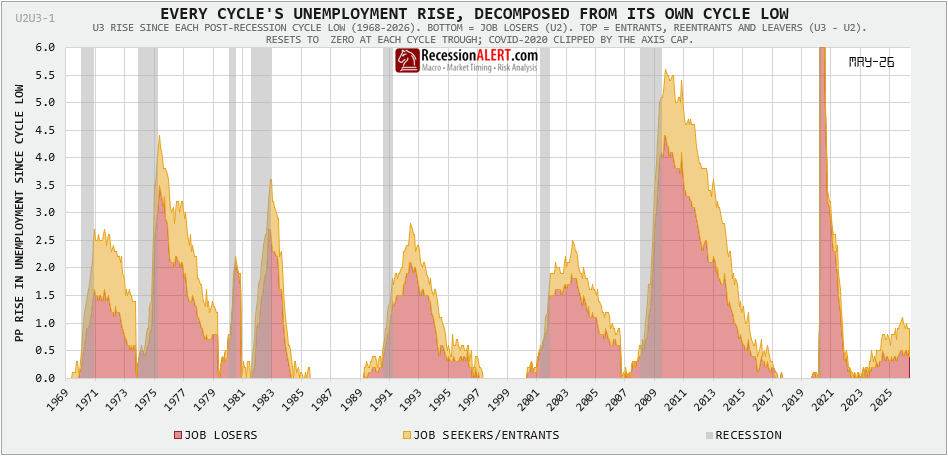
The unemployment rate is a single number, and a single number hides its own anatomy. When it rises, it can rise for opposite reasons: because people are being pushed out of jobs, or because people are arriving to look for them. A layoff and a fresh job-seeker each add one to the count of the unemployed; the rate cannot tell them apart. But the underlying data can, because the government publishes unemployment by reason. Sort every rise in U.S. unemployment since 1968 into the share driven by people who lost jobs and the share driven by everyone else — new entrants, re-entrants, voluntary leavers — and a pattern emerges that has held through eight recessions without a single exception. Every recession is a job-loss event. The losers’ share dominates the rise; the seekers’ share is a thin band riding on top.
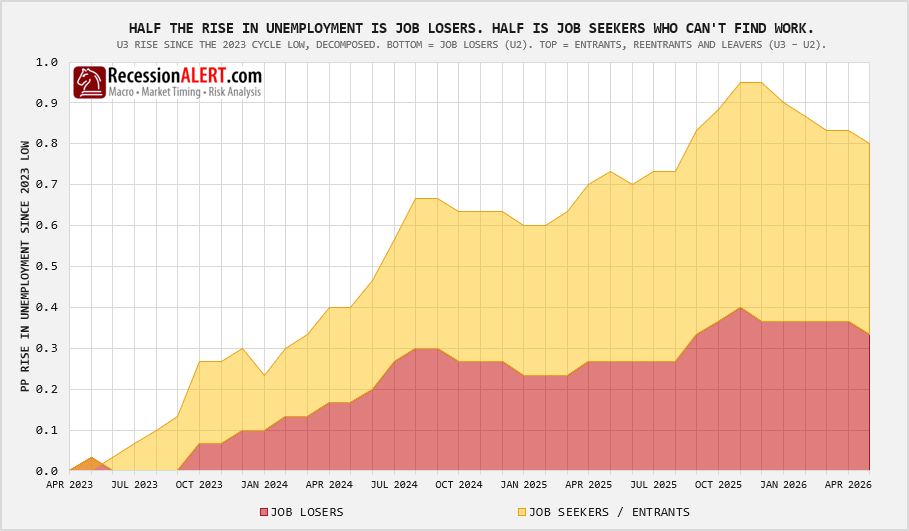
This cycle breaks the pattern outright. It is the first rise in fifty-seven years in which the seekers, not the job-losers, make up the larger half. Of the roughly one full percentage point that unemployment climbed from its 2023 low, only about 0.45 came from people losing jobs; the rest came from people entering the labour force and failing to find work. In every prior episode the ratio ran the other way, often overwhelmingly — the job-loss share approached the entire move in 2008 and in 2020. The current episode is not merely smaller than those downturns. It is composed differently, and on the historical record it is composed like nothing that has ever preceded a recession.
There is a cleaner way to see it. Take the same decomposition and reduce it to one line: the seekers’ contribution minus the losers’. Below zero, layoffs dominate — the signature of a contracting economy. Above zero, seekers dominate — the signature of a healthy one, where the only people still unemployed are those moving between jobs. Run that line across every cycle since 1968 and it tells the whole story in a single stroke. Every recession drives it deeply negative: to −0.7 in the mildest case, past −2.0 in the downturns of 1975, 1980 and 1982, to −3.4 in 2008, and clean off the chart in 2020. The layoff signature is unmistakable, and it is always there.
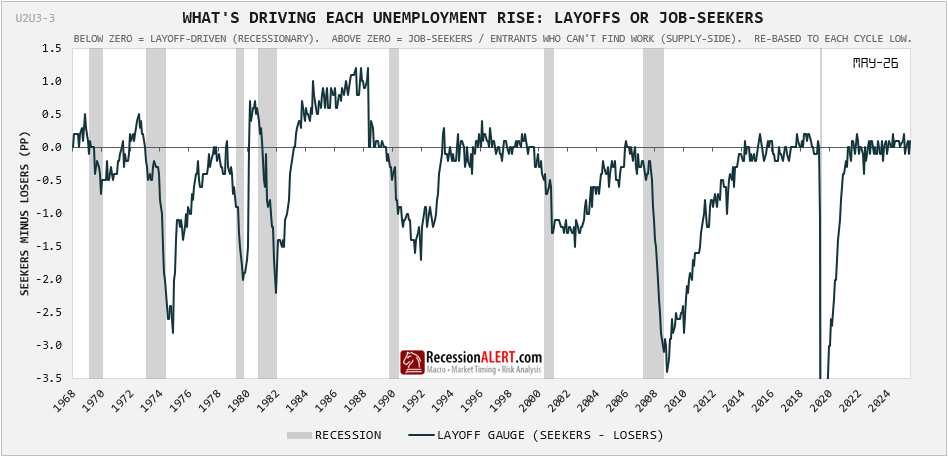
This cycle, the line never went there. It touched −0.4 at the very start, at the cycle’s low, then turned positive and stayed positive through the entire rise, sitting today at +0.1. The unemployment rate climbed a full point and tripped the most trusted recession rule in macroeconomics — and the composition gauge underneath it never once produced the layoff signature that every genuine recession has carried. By the only measure that separates cause from count, this rise has no recession in it at all.
Every recession since 1968 has carried the same fingerprint: layoffs driving the rise. This is the first that never showed it.
That combination should not occur. A seeker-dominated composition belongs to the late, healthy stage of an expansion, when unemployment is low and the only joblessness left is frictional. To see it while the unemployment rate is climbing is a contradiction — unless the climb is not coming from the economy weakening at all, but from something arriving on the other side of the ledger. It was.
What arrived was people. Between 2022 and 2023, net immigration into the United States ran at 3.1 and then 3.5 million a year, against a 2010-2019 average near 900,000 — a labour-supply surge without modern precedent. New arrivals enter the labour force before they find work; for a period they are counted, correctly, as unemployed. A wave of that size lifts the unemployment rate mechanically, through the entrant count and the denominator, without a single job being lost. This is the seekers’ half of the rise, and it is why the layoff gauge never moved: there were no layoffs behind it, only arrivals.
Strip the surge out, and the genuine signal remains. The narrower gauge built only on job-losers — the one Redux singled out — rose too, but by half as much: about 0.5 of a percentage point against the headline’s full point. That residual is real. It is a true, if mild, softening in the demand for labour. The economy did slow this cycle. It simply slowed about half as much as the headline rate implied, because the other half was supply arriving, not demand failing. Not everyone accepts even that split — the Minneapolis Fed, for one, has argued that immigration cannot account for the weaker hiring — but the decomposition grants the objection in advance: half the rise is conceded as genuine demand-side softening, and only the other half is laid at supply’s door.
The softening took an unusual shape. Employers did not shed workers — layoffs stayed historically low and the rate of involuntary separation never rose. What they did instead was stop hiring. The pace of hires fell to its weakest since 2013 outside the pandemic; net payroll gains slowed to roughly 40,000 a month through 2025 and into 2026. In a market that is neither firing nor hiring — the “low-hire, low-fire” economy, in the Federal Reserve’s own phrase — the people who suffer are not those with jobs but those looking for one. More than six million Americans resumed searching for work in a single quarter of 2025, and the flow out of unemployment into jobs could not keep pace; the average spell of unemployment stretched to twenty-four and a half weeks, a three-year high. The rise in joblessness was real, but it fell almost entirely on job-seekers meeting a frozen hiring door — not on workers being pushed through it.
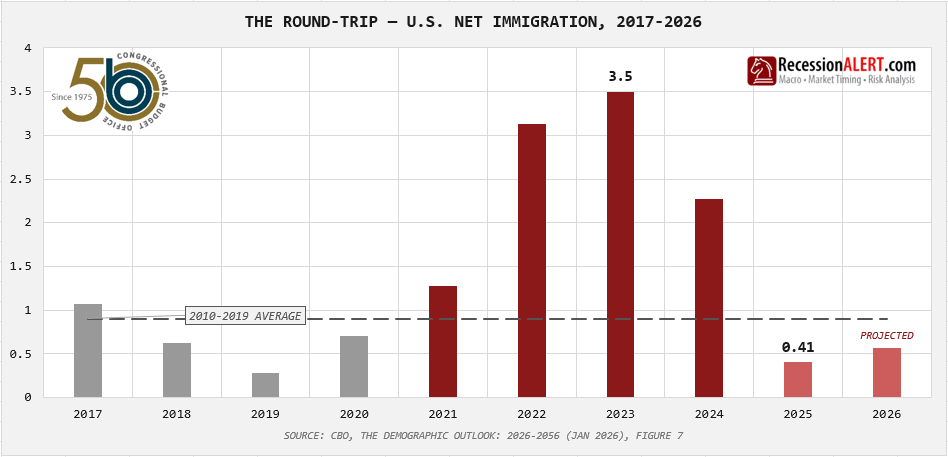
Then the wave that began the sequence went into reverse. Net immigration collapsed from 2.3 million in 2024 to a CBO-estimated 410,000 in 2025, with the surge-specific inflow — CBO’s “other foreign nationals” category — actually reversing to a net outflow. The foreign-born population fell by roughly 1.5 million in the first half of 2025 alone, and about 1.2 million workers left the labour force. The same denominator effect that drove the rate up now began to pull it down: as labour-force growth collapsed, the number of jobs needed merely to hold unemployment steady — the breakeven pace — fell with it. A 170,000-job month, barely adequate in 2023, now sits comfortably above breakeven. Unemployment has ticked down not because hiring recovered, but because the supply of workers stopped growing. The whole arc, up and back down, is a labour-supply round-trip, not a business cycle.
The geography says the same thing. The state and metro versions of the rule count breadth — how many places have each tripped their own line, every place weighed equally — whereas the national rule is population-weighted, dominated by a handful of the largest states. By construction the diffusion gauges have always run hotter and turned earlier than the headline: weakness spread across many smaller states shows up loudly in the count but only faintly in the average. So the screaming map is not a second opinion catching a downturn the national number missed — the national depth stayed modest throughout. It is the same shallow softening, counted by place rather than by size.
Why it ran hotter still this cycle, beyond that built-in lead, the national numbers cannot settle — and the honest course is to name the possibilities rather than gloss them. Either the softening reached genuinely more states than a typical slowdown, or the immigration that drove it landed unevenly, concentrated in the gateway states and metros that absorbed the largest inflows and tripping their lines without uniform weakness behind them. The two would draw different maps but return the same verdict: neither is a hidden recession, and the second, if it holds, is only this note’s composition story told in geography. Disentangling them takes state-level data — a thread we will return to.
“It doesn’t hold the typical pattern, which means our typical tools to fight [it] like a recession may not be the right ones.”
The composition explains the false alarm. It does not yet explain the disagreement — why two versions of the same rule, reading the same data, can land at 0.10 and 0.90 in the same month. That gap comes from the second design choice: not which series you measure, but where you anchor the low you measure against.
The rule measures how far unemployment has risen above a recent low, and “recent” is the operative word. The standard rule looks back twelve months — today’s rate against the lowest point of the past year. A second variant ignores the calendar and anchors to the lowest point of the entire cycle, however far back it sits. In an ordinary downturn the two are nearly identical, because unemployment falls to its cycle low and then turns up sharply; the twelve-month low and the cycle low are months apart, not years, and the choice of anchor barely matters.
This cycle it matters enormously, because the rise was slow and then flat. Unemployment bottomed in early 2023 and has drifted up over the more than three years since, settling onto a plateau rather than spiking. A twelve-month window cannot see a low that is three years old. As the rate sat on its plateau, the rolling twelve-month low climbed up to meet it, until the standard rule was comparing the plateau to itself and reading near zero — 0.10. The cycle-anchored version never releases the true 2023 bottom, so it still registers the full rise — 0.90. One gauge has forgiven the move by quietly resetting its baseline to the new normal; the other refuses to forget. Same data, opposite verdicts, and the only difference is the memory of the instrument.
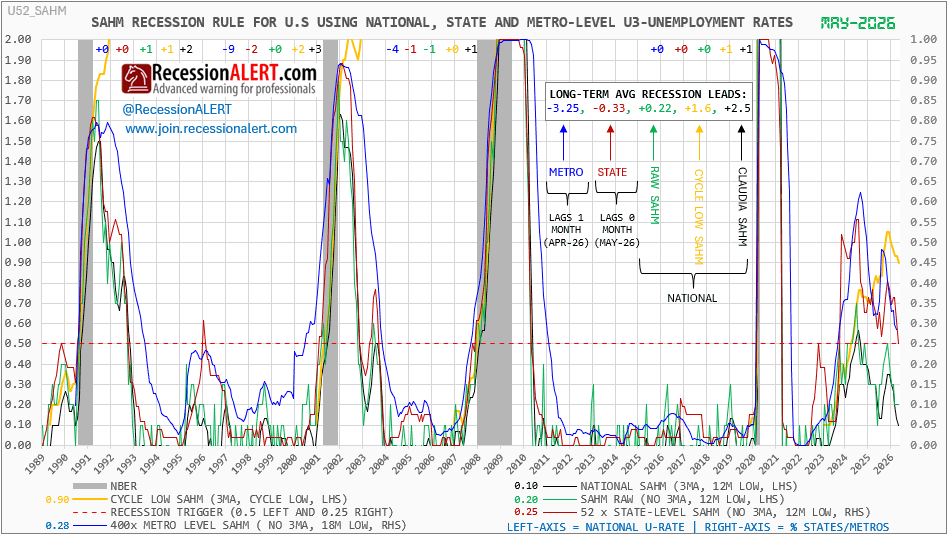
The instinct is to ask which one is right. The better question is what their disagreement measures. The gap between them — 0.90 minus 0.10 — is not noise. It is, almost exactly, the portion of the rise that is more than a year old and has not reversed: the height of the plateau above the 2023 floor. In a normal cycle that gap is small, because unemployment does not sit elevated for years without either recovering or tipping over. A large gap is therefore a signal in its own right.
And there is a deeper reading. The two anchors are not rival measures of one quantity — they measure different things. The cycle low captures the total distance unemployment has travelled from its best point: cumulative deterioration, a fair gauge of how much stress the labour market has absorbed. The twelve-month low captures the speed of the recent rise — and recessions are speed events. A labour market can absorb a slow drift higher over years; a sharp rise feeds on itself, the non-linearity the rule was built to catch. The cycle-low gauge is not useless, then; it simply answers a different question than the one a recession signal asks.
The gap between the two gauges is not a flaw to resolve. It is a measurement — of an unemployment rate lifted to a new plateau and held there without a recession. The divergence is the rule inadvertently detecting the one thing that makes this cycle unlike any other.
Two design choices, then, govern what any version of the Sahm rule reports: the series it measures, and the anchor it measures from. Each choice has a right answer and a failure mode, and this cycle exposed both. Lay the four combinations out as a grid.
The Four Combinations — Anchor × Series, May 2026
| Sahm variant | 12-Month Anchor | Cycle-Low Anchor |
|---|---|---|
| U3 — headline rate | 0.10 · No call — but the window erased a real softening | 0.90 · Recession call — immigration never stripped out |
| U2 — job-losers only | 0.40 · Touched, not exceeded — correct | 0.60 · Recession call — level shift never forgiven |
Green — the one cell right on both the call and the texture: the right series (immigration stripped out) on the right anchor (a one-time level shift forgiven). Crimson — a recession call this cycle did not deliver. Muted — a no-call that hid the genuine softening underneath.
The series choice is between the headline rate, which counts everyone, and the narrower job-loser rate, which counts only those who actually lost work. The anchor choice is between the twelve-month low and the cycle low. Three of the four combinations fail this cycle, each in its own way. The headline rate on a cycle anchor reads 0.90 and calls a recession — wrong, because most of that rise is immigration the series cannot strip out. The headline rate on a twelve-month anchor reads 0.10 and calls all-clear — also wrong, because the window has erased a real softening by resetting to the inflated plateau. The job-loser rate on a cycle anchor reads about 0.6 and calls a recession too — it correctly removes the immigration distortion, but its unforgiving anchor still treats a one-time level shift as ongoing decline.
One combination is left, and it is the one Redux named two years ago: the job-loser rate measured against its twelve-month low. The right series on the right anchor — immigration stripped out by the series, the one-time level shift forgiven by the window.
This cycle it rose to exactly 0.4 — the level at which a recession call is triggered — and stopped. It touched the line and did not cross it. Of every gauge in the family, it is the only one that declined to call a recession, and it did so not by sleeping through the move but by registering the genuine softening right up to the threshold and going no further. A rise that reaches the doorstep of recession and holds there is the textbook signature of a soft landing, and this is the one instrument that drew it.
A purist will object that the job-loser rule carries a higher, safer trigger — 0.6 rather than 0.4 — set to erase its one historical false alarm, in 1992. But that signal was not really false — it was the predictable blind spot of a job-loser gauge, firing during the jobless recovery that followed the 1990-91 recession. A jobless recovery is, by definition, a stretch in which labour-market weakness lingers after the downturn has officially ended; unemployment kept drifting higher for more than a year, and the one indicator built to read job losses naturally stayed elevated even as the economy was, in fact, healing. No modern recession has ever begun within twelve months of the previous one ending — so a fresh recession signal arriving that soon after a recession is a recovery artifact, not a new call, and the convention discounts it on exactly that basis. On the 0.6 trigger the job-loser rule has not produced a single false positive in nearly sixty years; apply the same twelve-month rule to set aside the lone 1992 reading, and even the more sensitive 0.4 trigger comes through clean. It is the sweet spot: the earliest honest warning the data allows. On that trigger, the job-loser rule touched the line and held. On the headline rule, every version blew through it.
This is the part Redux anticipated. Having catalogued the whole family two years ago, it closed by arguing that the job-loser series would prove the most reliable of all — least distorted by the labour-supply swings already visible in the data. The cycle that followed was the hardest possible test: a supply shock large enough to send every headline-based version of the rule into a false alarm. The job-loser rule passed it. Every other member of the family failed, exactly as The SAHM Rule Redux said they would.

For an investor, the distinction between a false alarm and a soft landing is not academic; it decides whether the right posture is defensive or patient. The evidence assembled here points to neither recession nor all-clear, but to the narrow ground between: a genuine, mild deceleration in labour demand, masked on one side by an immigration surge that inflated the headline and on the other by a measurement window that erased it. The labour market softened. It did not break.
The posture that follows is patience, not defence. An investor positioned for an imminent recession on the strength of the headline trigger has been positioned wrongly for eighteen months and has paid the carry for it. The data describe a slowing but intact expansion — the environment in which risk assets grind higher with more volatility, not the one in which they break. The cleaner expression is to fade recession-driven drawdowns rather than chase them; to favour quality and resilient cash flows over deep-cyclical bets that need a reacceleration which is not coming; and to treat the labour market as a source of sticky, supply-driven inflation risk rather than the demand collapse the recession narrative implies. The investor who reads the composition is better positioned than the one still reading the headline.
The base case is a soft landing, not a recession: a real but mild deceleration in labour demand, roughly half the size the headline rate implies, now cushioned by a reversing labour-supply shock. Position for a slowing expansion with sticky inflation, not a contraction. The single most informative number is the job-loser Sahm gauge at its 0.4 threshold — the one instrument that has read the cycle correctly. While it holds the doorstep, the soft landing holds with it.
The risk is that the doorstep does not hold. The job-loser gauge sits at its trigger, not comfortably below it; the softening it measures is real, and a low-hire economy can become a low-hire, high-fire one quickly if demand cracks. Should that gauge exceed 0.4 and stay there, the soft-landing read converts into an early recession warning — and, unlike the headline rules, this is the gauge whose warning would deserve to be believed. The probability is not negligible — on the order of one in three over the coming year, broadly in line with consensus — but it is simply not the base case, because every coincident measure — output, hiring intentions, the absence of a layoff wave — still describes deceleration rather than contraction. The thesis is the better base case precisely because it rests on the one gauge that has not yet been wrong. That is reason to watch it closely — not reason to watch it alone. The lesson of this cycle is precisely that the most trusted single rule can be quietly regime-broken; the job-loser gauge is the sharpest read on the question at hand, but it belongs as the lead signal within the broader suite of recession indicators we track, not as a substitute for them.
The recession every headline gauge promised never came — because half of what they measured was never job loss to begin with. The one gauge that counts only the jobs actually lost saw it, rose to the doorstep, and stopped. Not a recession. A soft landing. Read the composition, not just the count.

Because it measures the magnitude of a rise in unemployment but is blind to its composition. For seventy years the two moved together — unemployment rose because people were losing jobs, so the size of the move was as good as a reading of its cause. This cycle they came apart: roughly half the rise was not job loss at all, but a record immigration surge the rule cannot tell from genuine decline. The rule did exactly what it was built to do; it was simply built to read one thing, and the cycle produced another.
Because the two readings are not better and worse versions of one measure — they measure different things. The cycle-low anchor tracks the total distance unemployment has travelled from its trough: cumulative deterioration. The twelve-month anchor tracks the speed of the recent rise. And recessions are speed events — a labour market absorbs a slow drift higher over years, but a sharp rise feeds on itself. This cycle was all distance and no speed, which is exactly why the cycle-anchored gauges screamed and the twelve-month gauges, rightly, did not.
Because the state and metro gauges count breadth — how many places have each tripped their own line, every place weighed equally — while the national rate is population-weighted, dominated by a handful of the largest states. Weakness spread across many smaller states shows up loud in the count but faint in the average. The screaming map is not a hidden downturn the headline missed; it is the same shallow softening, counted by place rather than by size.
It was 1992 — not 1982, which was a genuine recession — and it was the predictable blind spot of a job-loser gauge. A jobless recovery is, by definition, a stretch when labour-market weakness lingers after a downturn has ended, so the one indicator built to read job losses stayed elevated while the economy was, in fact, healing. And since no modern recession has begun within twelve months of the previous one ending, a signal that soon after a recession is a recovery artifact, not a fresh call. Discount it on that rule, and the more sensitive trigger carries no live false alarm at all — the sweet spot.
Because only one combination sat at the intersection of the right anchor and the right series: the job-loser rate, which strips out the immigration distortion, measured against its twelve-month low, which forgives a one-time level shift. Every other variant failed in its own direction — over-calling the recession or over-forgiving the rise. That lone gauge climbed to its 0.4 doorstep and stopped: a soft landing captured in a single data point — and the very indicator the house predicted, two years earlier, would prove the most reliable of all.
Five puzzles, one root cause: a labour-supply shock the rule was never built to see. That is what turns a set of anomalies into a thesis — and why the gauge that counts only the jobs actually lost is the one that read the cycle right.
The SAHM Rule Redux — RecessionAlert in-house methodology: the full Sahm-variant family, variant track records, and the U2 job-loser prediction
U.S. Bureau of Labor Statistics — U3 (UNRATE) and U2 (U2RATE) unemployment series, Employment Situation, JOLTS, Monthly Labor Review
Federal Reserve Economic Data (FRED) — series provenance and construction for the Sahm-variant calculations
Congressional Budget Office — net immigration and Demographic Outlook (2022-2025 surge and reversal)
National Bureau of Economic Research — U.S. recession dating (USREC)
Federal Reserve Banks of Kansas City, San Francisco, St. Louis and Atlanta — breakeven employment growth, the low-hire / low-fire economy
Claudia Sahm / Brookings — origin of the Sahm rule and January 2026 Fortune commentary on the broken pattern
RecessionAlert — U2-SAHM and decomposition workbooks (U2RATE / UNRATE, FRED-sourced)
Comments are closed.