
“Full Employment” target reached
Shortly after taking up office, Federal Reserve Chair Janet Yellen used her “jobs data dashboard” to justify the Fed’s easy money policies and to argue there’s still considerable slack in the labor market five years after the recession’s end. Seven of the nine gauges on this dashboard had not recovered to levels reached before the last recession, reinforcing her belief that the economy would need “extraordinary support” from the Federal Reserve for “some time to come.” It appeared at the time that the Federal Reserve had changed emphasis from their singular focus on the unemployment rate to a broader labor market approach, which was the right thing to do. The Federal Reserve went so far as to state that policy would remain accommodative well beyond the prior target threshold of 6.5% for the unemployment rate since the new guidance objectives are “Full Employment” and “2 % inflation.”
Whilst we have been regularly publishing a Labor Market Report for clients since October 2012 to gauge exactly what we thought the Federal Reserve ought to be looking at, the collection of indicators in Yellen’s dashboard had some interesting additions to our one. More specifically we felt there was a risk that several of the components she had chosen may paint a picture of more slack in the market than realistically existed, but maybe its was a good thing to look at the worst case scenario. Nonetheless, since we now had specific details on exactly which nine labor components the Federal Reserve would be examining on a monthly basis, we felt it would be prudent for our clients to keep their eyes on the exact same things the Federal Reserve was using to gauge the conditions of the economy.
We compiled a “Yellen Labor Dashboard” which we have been including as an addition to our standard monthly Labor Market Report for our subscribers. All the indices have been re-based to zero at the peak of the last business cycle and normalized so that they touch -100 at their worst point reached since then. About 12 months ago we began projecting when the labor composite would reach the prior business cycle peak (“full employment”) to give our clients an idea of when we should be expecting the Fed to be compelled to raise interest rates (assuming they stuck to their story-book, of course). This projection commenced around 1Q2015 and fluctuated slightly with each passing month, slowly rising to late 2Q2015. About 6 months ago it extended out to 3Q2015 as the rise of the labor composite waned, and about 3 months ago we began pinning this down to the end of September 2015 (when the July print of the index would reach its prior peak.)
We have updated this index with the relevant labor data today and can announce that the Yellen Labor Dashboard has now reached and surpassed the peak achieved in the prior business cycle, one month ahead of schedule (August), just in time for the Fed meeting in September: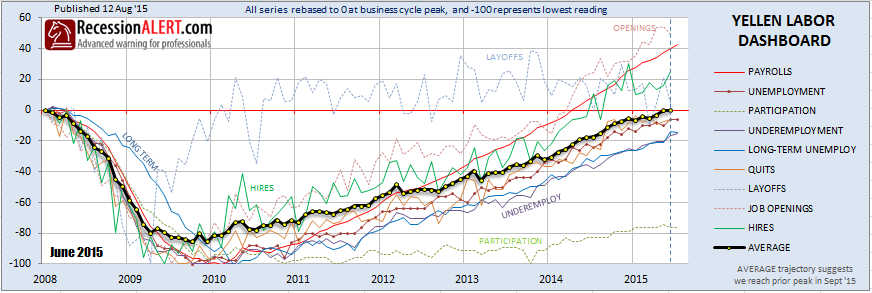
Although the equally weighted Labor composite and 4 of its components have exceeded their prior peaks, we still have 5 components below (with the participation rate being well below due to certain demographic structural factors.) As we stated some 12 months ago, we fully expected the Labor composite to reach the prior peak sans 4 or 5 of its underlying components, but that we did not think that would have any bearing on the “full employment” status of this achievement.
So there is finally a tick in the box for the employment situation. The only missing piece is the 2% inflation target. If the Fed elects not to raise rates in their September meeting then the inflation outlook or other external global factors will likely be held responsible, not the labor market.