
The SP-500 today has met back with its 200-day moving average after spending a “protracted period” of 46 trading days below it. Contrary to popular belief, history since 1972 shows this to be a bearish event, with more downside likely.
Many participants on the stock markets like to use the 200-day moving average (200dma) to determine if we are in a bull or bear market. We deploy far more robust, diverse and accurate models as described in our highly popular research note “Seven Paw-Prints of the Bear” and our Macro-economic composite called the “Recession Forecast Ensemble“. We find daily closes of the SP-500 below the 200-day moving average subject to many false positives (false alarms) and in a bull market, many visitations of the SP-500 below the 200dma are actually great buying points.
Since 1972, there have been 56 penetrations lasting more than 2-days of the SP-500 and its 200dma. However, only 24 of these (43%) would have proved useful in avoiding further draw-downs and/or volatility. As a general rule, ignoring consecutive visitations below the 200dma of less than 14-20 days will eliminate 80% of these false positives. This is why switching to monthly closes (which are roughly 20 daily bars) and tracking them against a 10-12 period moving average is a more favored choice among market participants, although this too is subject to (albeit less) false positives.
Using daily SP-500 data and its 200-day moving average in other ways can however provide very useful information to market participants. We examined all protracted visitations of the SP-500 below its 200-day moving average since 1972. Protracted visitations must satisfy at least one (preferably both) of the following criteria:
- The 200-dma is pointing downwards or
- The SP-500 has been below the 200dma for at least 20 days.
Amazingly, there have only been 13 instances of the initial commencement of “protracted penetrations” since 1972. These are instances when either of the above criteria have been met and there has not been a prior protracted penetration in the last 100 days. They are cataloged below:
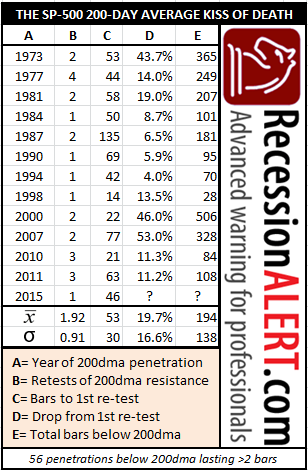
Whilst using our expanded definition of a “protracted penetration” will allow you to avoid many false alarms when used to exit the stock market as a bear-market avoidance technique, the “Goodbye Kiss” syndrome found in these protracted events is in itself far more useful. The “Goodbye Kiss” is when after the initial commencement of a protracted period below the 200dma, the SP-500 attempts an assault on the 200dma in a “retest” of resistance, by rising to within 2% of the 200dma or breaking through it. In every of the 13 instances since 1972, the SP-500 fails at least once to breakout from the 200dma.
Think of it this way: the 200dma acts as a massive support level on the stock market. Breaches below it are very rare and in the majority of cases, closing above the 200dma from below is normally a sign of a renewed strong up-leg for the market. Because the 200dma is such a powerful support level for the SP-500, once we have entered a protracted period below it, it now becomes an equally powerful resistance level. That is why there is at least one failed test of resistance during protracted periods below the 200dma. This is probably where the term “Goodbye Kiss” came from!
The table above shows that it takes 23 to 83 trading days (bars), or an average of 63 bars below the 200dma before the “Goodbye Kiss” occurs. The “Goodbye Kiss” can be when the SP-500 comes within 2% of the 200dma or breaks out above the 200dma for 2-5 days. The history also shows us that this attempt to breach or temporary breakout of the 200dma is likely to be short lived and result in a further 3% to 36% (average 19.7%) correction.
Whilst there are no guarantees that history implied by the above table will repeat itself, and the sample of 13 events is relatively “lightweight” in statistical terms (although the time-span is itself statistically significant) the insight provided by it may be useful in several ways to manage risk or maximize returns during a protracted visitation of the SP-500 below its 200dma:
- Only exit long positions or hedge them when you witness the first 200dma re-test or breakout – 100% implied success rate of further declines
- Short the market when you witness the 1st or 2nd failed 200dma re-tests – 100% implied success rate of further declines
- Reintroduce long positions the day you witness a 3rd 200dma breakout cluster – 67% implied success of calling a new bull market up-leg
- Reintroduce long positions the day you witness a 4th 200dma breakout cluster – 92% implied success of calling a new bull market up-leg
A “breakout cluster” is a period of closely knit (within days of each other) attempted breakouts on the 200dma. Whilst the above set of rules are not likely to be perfect in their entirety every time, they encapsulate the best odds implied by the historical table.
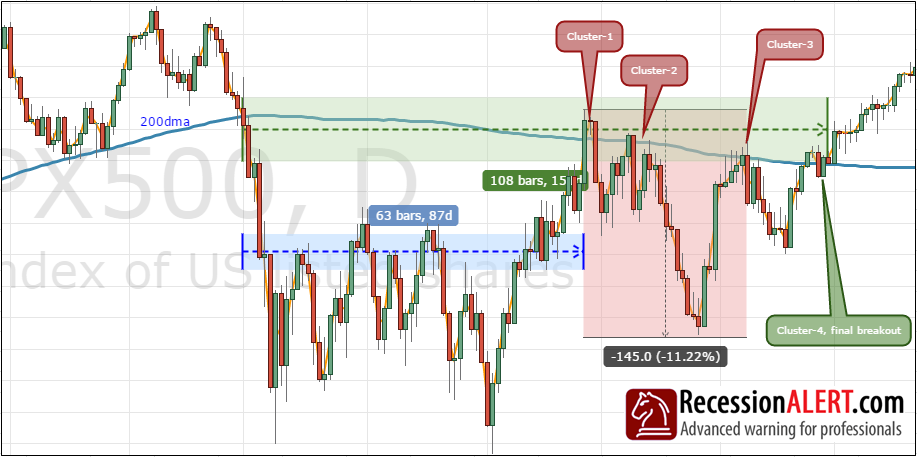
Below is an example of the last protracted period of the SP-500 below its 200dma, from the May 2011 correction:
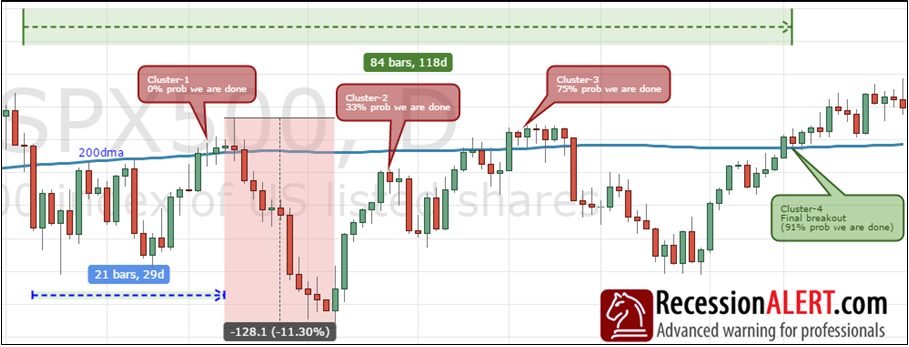
Here is an example of the period before the above one, from the April 2010 correction:
I’ve been a subscriber for several years now – just want to tell you that your work is excellent. Very much appreciate your service.
Thanks so much for that feedback Rob. As is evident now the goodbye kiss did indeed lead to a very hectic new low…Sorry for the belated response.