
There have been numerous queries about the new TRENDEX chart in the PRO Charts section.
This model supersedes the Demark and the Demark+ trend counting models as it is a far superior methodology focusing on support and resistance levels as opposed to closes 4 days ago and moving averages.
The methodology was a by-product of the research done on the SP500 Probability Model when initially using DEM+ as one of the six model components and realizing there was a better way to track downtrends more persistently without whipsaws. The superiority on the downtrends applied to the up-trends as well, meaning we could issue probabilities of market tops as well as market bottoms.
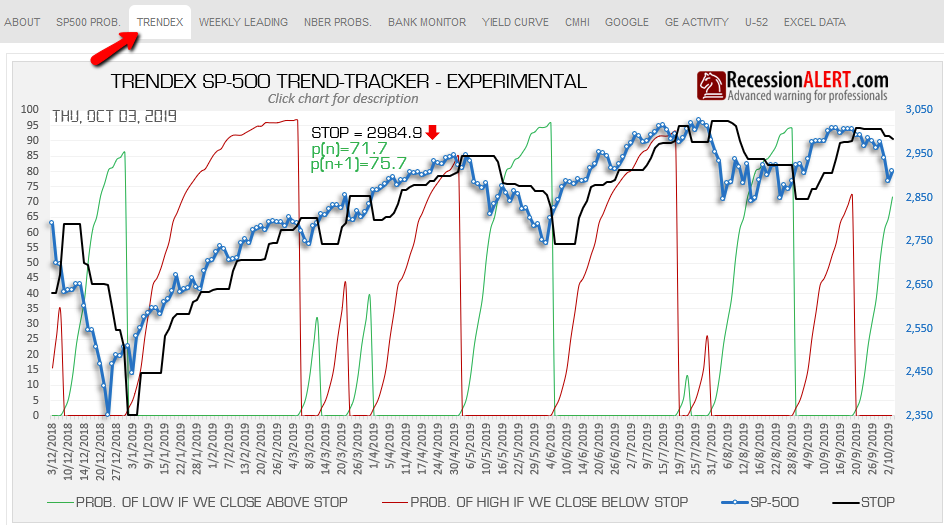
- STOP = cancel level for current trade (arrow depicts movement from prior day)
- p(n) = probability of last day depicted on chart
- p(n+1) = probability tomorrow if we don’t cross the black line
Apart from using support and resistance in counting trend duration as opposed to arbitrary closes 4 days ago and moving averages subject to whipsaws, the TRENDEX also differs from DEM and DEM+ in that we dispense with standard daily counts of a trend and dynamically map these to actual probabilities these counts represent from the historical record of success of a trend reversal. This is far more intuitive than daily counts especially if it means the historical record is changing all the time with new daily data.
We fully expect to retire DEM and DEM+ in their entirety with the TRENDEX once it has been fully documented and potentially refined further in months ahead. We are scheduling a detailed research note on the TRENDEX and we will maintain the PRO-Chart daily until then.
Note that currently the SP500 Trendex is a component in the multi-factor Market TOP probability model found in the “SP500 TOP” tab. We have yet to roll out multi-factor peak-detection models for the various other ETF we maintain probability models for.
Comments are closed.