
Economic Wrap is a quarterly series aimed at taking an objective, evidence-based balanced view snapshot of the US and Global economies – which of course has major implications on all stock markets. It references publicly available data at the time as well as more advanced or sophisticated proprietary models from RecessionALERT that are not publicly available.
In summary, the analysis below provides an evidence-based analysis of the U.S. and global economies, highlighting a complex outlook. The U.S. labor market remains resilient with a 4% unemployment rate, consistent job growth (249,000 monthly gains since May 2024), and wages outpacing inflation (4.5% vs. 2.5%), while GDP and GDI data and NBER coincident models stay above recessionary levels, though leading indicators like the USMLEI (48% recession probability) Recession Diffusion (66% recession probability) and weakening leading labor metrics signal not inconsequential vulnerability. Globally, recovery is underway post a Q3 2023 slump, with the IMF projecting 3.3% growth for 2025, supported by rising G20 LEIs and global central bank monetary policy easing. However, risks persist, including inverted yield curves, declining consumer sentiment, and stagnant U.S. industrial production, creating a mixed picture where recession odds are non-trivial and elevated but not yet dominant. The biggest wild-card for now remains the effects and reaction of the markets and global trade to the recently announced Trump reciprocal tariffs.
1. U.S Economy Recession signals
Here we examine general, widely available public indictors, prediction markets and expert models warning of U.S recession. Several US indicators and models are currently signaling an elevated risk of a recession within the next 6-12 months, as of March 31, 2025. Here’s a breakdown of the key ones based on recent economic data and expert analyses:
1.1 Inverted Yield Curve:
The yield curve, particularly the spread between the 10-year and 3-month Treasury yields, has historically been a reliable predictor of recessions. When long-term yields fall below short-term yields (inversion), it often signals economic slowdown within 12-18 months. As of early 2025, parts of the yield curve have re-inverted, with the 10-year yield dipping below the 3-month yield. The New York Federal Reserve’s model, which uses this spread, recently estimated a recession probability of around 27% for the next 12 months, though earlier in February 2025 it was as high as 58% before adjusting with new data. Despite some questioning its reliability post-COVID, it remains a widely watched indicator.
1.2 Sahm Rule:
Developed by economist Claudia Sahm, this rule suggests a recession is underway when the three-month moving average of the unemployment rate rises by 0.5 percentage points or more above its lowest point in the prior 12 months. While unemployment has increased moderately (hovering around 4% in early 2025), it hasn’t yet triggered the Sahm Rule threshold. However, if joblessness spikes in upcoming reports (e.g., April or May 2025), it could flash a stronger recession signal, especially given softening labor demand noted in recent analyses.
1.3 GDP Nowcasts:
The Atlanta Federal Reserve’s GDPNow model recently indicated negative growth for Q1 2025, with estimates dipping into contraction territory (e.g., -2.8% cited in some posts on X). While not a long-term forecast, this real-time tracker suggests economic activity may already be faltering, raising recession risks if the trend persists into Q2. Full-year 2025 growth is still projected at 2.6% by some economists, but a sharp quarterly decline could shift sentiment. More recently gold imports have been fingered for skewing this forecast and if they are removed, the Q1 2025 growth shifts to +0.25%.
1.4 Consumer Confidence Index:
The Conference Board’s Consumer Confidence Index dropped significantly in February 2025 (to 98.3, down 7 points), the steepest decline since August 2021. The Expectations Index fell below 80 (to 72.9), a level often associated with an impending recession. Over 67% of consumers surveyed expect a downturn within the next 12 months, reflecting pessimism that could curb spending—critical since consumer spending drives about 70% of GDP.
1.5 Prediction Markets and Expert Models:
Platforms like Polymarket estimate a 40-41% chance of a recession in 2025, influenced by trade policy uncertainties under the new Trump administration. J.P. Morgan’s model aligns with this, pegging a 45% probability by year-end 2025, up from 35% earlier, citing tariff risks and slowing growth. Bloomberg Economics’ model recently raised its 12-month recession odds to 38%, incorporating factors like housing permits and consumer surveys. Goldman Sachs just increased its 12-month recession probability for the U.S to 35% from 20%
1.6 Other Leading Indicators:
The Conference Board’s Leading Economic Index (LEI) and the OECD’s leading indicators have shown mixed signals, with some components (e.g., manufacturing orders, bank lending conditions) flashing negative in May 2024 data, per S&P Global. Corporate CFO surveys (e.g., CNBC’s Q1 2025 poll) also predict a recession in the second half of 2025, driven by trade war fears and policy uncertainty, with 95% of CFOs noting impacts on business decisions.
1.7 Context, Caveats & Summary:
- Timing Variability: The yield curve’s signal can precede a recession by up to 18 months, so an inversion now might point to late 2025 or early 2026. The Sahm Rule and GDP nowcasts are more immediate, reacting to current data.
- Mixed Signals: Despite these warnings, job growth remains solid (e.g., 249,000 monthly average in May 2024), and household spending has held steady, per Census Bureau data. This suggests the economy isn’t in freefall yet.
- Policy Impact: Trump’s proposed tariffs and immigration policies are wild cards, potentially amplifying risks by raising costs and constraining labor supply, as noted by J.P. Morgan and CNBC surveys.
- In Summary: The inverted yield curve, weakening GDP nowcasts, declining consumer confidence, and elevated probabilities from models like those of the NY Fed, J.P. Morgan, and Polymarket are the primary indicators pointing to a potential recession within 6-12 months (i.e., by September 2025 to March 2026). However, the absence of a full Sahm Rule trigger and resilient job/household data temper the immediacy, suggesting a slowdown rather than an imminent collapse—unless external shocks (e.g., tariffs) accelerate the downturn. Keep an eye on unemployment reports, Q2 GDP and developments on US tariffs policy for clearer confirmation.
2. U.S Economy Expansion signals
Here are additional important counterpoints specific to the US economy that argue against a recession within the next 6-12 months (i.e., by September 2025 to March 2026). These factors highlight resilience and could offset some of the recessionary signals previously mentioned:
2.1 Strong Labor Market Persistence:
Despite a slight uptick in unemployment (around 4% in early 2025), the US job market remains robust. The May 2024 average of 249,000 monthly job gains (per Census Bureau data) and a low layoffs rate suggest employers are holding onto workers, a stark contrast to pre-recession periods like 2007. Wage growth, while moderating, still outpaces inflation (e.g., 4.5% annualized vs. 2.5% CPI), bolstering household income. A resilient labor market could sustain consumer spending, delaying or averting a downturn through late 2025.
2.2 Consumer Spending Resilience:
Consumer spending, which accounts for roughly 70% of US GDP, has held steady despite confidence dips. Retail sales data from the Census Bureau show consistent growth into early 2025, supported by excess savings from pandemic-era stimulus (estimated at $1.5 trillion remaining by some analysts). Holiday spending in 2024 exceeded expectations, per Mastercard, signaling that households aren’t yet in retrenchment mode—a key buffer against recessionary pressures into mid-2025.
2.3 Monetary Policy Flexibility:
The Federal Reserve has room to maneuver after pausing rate hikes in 2024 and signaling potential cuts in 2025 if growth falters. With inflation near the 2% target (2.5% in recent estimates), the Fed could lower rates by 50-100 basis points by Q3 2025, stimulating borrowing and investment. This contrasts with pre-2008 conditions when rates were already high, leaving less room to act. Goldman Sachs cites this flexibility as a reason for their 35% recession odds, arguing it could extend the expansion through 2025.
2.4 Corporate Profit Strength:
S&P 500 earnings grew by 7% in 2024, per FactSet, with Q1 2025 projections holding steady at 6-8%. Tech and energy sectors, bolstered by AI investment and stable oil prices, are driving profits, cushioning the broader economy. Strong balance sheets—built from post-COVID cost-cutting—mean fewer firms are at immediate risk of distress, even if growth slows. This corporate resilience could keep investment and hiring afloat into 2026.
2.5 Housing Market Stabilization:
Unlike pre-2008, the housing sector isn’t a bubble primed to burst. While building permits have weakened (a recession signal in some models), home prices remain elevated due to low inventory, and mortgage rates have eased slightly from 2023 peaks (e.g., 6.5% for 30-year fixed in early 2025). The National Association of Realtors reports steady demand, suggesting housing won’t drag GDP down as it did in past recessions—potentially stabilizing growth through late 2025.
2.6 Fiscal Policy Boost:
The Trump administration’s agenda, including tax cut extensions and infrastructure spending, could inject stimulus into the economy starting in 2025. While tariffs pose risks, the Congressional Budget Office estimates that proposed tax relief could add 0.5-1% to GDP growth annually. If implemented swiftly, this fiscal tailwind might offset trade-related headwinds, pushing recession risks beyond March 2026.
2.7 Energy Price Moderation:
US energy independence and OPEC+ production adjustments have kept oil prices in a manageable range (e.g., $70-80/barrel in early 2025). This avoids the stagflationary shocks of past downturns, preserving disposable income and business margins. Lower energy costs could sustain economic activity through mid-2025, countering global commodity volatility.
2.8 Context and Implications:
These counterpoints suggest the US economy retains significant buffers: a tight labor market, healthy consumer and corporate finances, and policy levers to stimulate growth. They align with optimistic forecasts like Goldman Sachs’ (35% recession odds) and contrast with gloomier indicators like the yield curve or consumer confidence drops. However, their effectiveness hinges on execution (e.g., Fed timing, fiscal rollout) and external factors (e.g., no major trade war escalation). If unemployment spikes unexpectedly or tariffs disrupt supply chains, these strengths could erode quickly.
In short, the US economy’s labor resilience, consumer spending, policy flexibility, and sectoral stability provide compelling counterarguments to a near-term recession. These factors could keep growth positive—or at least delay a downturn—into 2026, barring significant shocks. Monitor jobs reports and Fed actions in Q2 2025 for confirmation of this trajectory.
3. U.S Economy Head-to-head
Determining whether the US recession arguments or the counterpoints “win the day” depends on weighing the strength, immediacy, and reliability of the evidence on both sides. Here’s an analysis to assess which set of arguments currently holds the upper hand:
3.1 Recession Arguments – Strengths :
- Historical Reliability: The inverted yield curve (e.g., 10-year vs. 3-month Treasury spread) has predicted every US recession since the 1950s with a lead time of 12-18 months. Its re-inversion in early 2025 strongly suggests a downturn by late 2025 or early 2026.
- Consumer Sentiment Drop: The Conference Board’s Expectations Index falling below 80 (to 72.9 in February 2025) has preceded recessions consistently, reflecting a self-fulfilling prophecy as spending slows. Over 67% of consumers expecting a downturn adds psychological weight.
- Model Consensus: J.P. Morgan (45%), Polymarket (40-41%), and Bloomberg Economics (38%) align on elevated recession odds within 12 months, bolstered by trade policy risks and GDP nowcasts showing Q1 2025 contraction (e.g., -2.8% per Atlanta Fed).
- External Risks: Trump’s tariff proposals (25% on Canada/Mexico, 20% on China) could disrupt trade, raise costs, and trigger retaliation, amplifying global and domestic slowdown signals by Q3 2025.
3.2 Recession Arguments – Weaknesses:
- Timing Uncertainty: The yield curve’s signal can lag by up to 18 months, pushing a recession beyond March 2026—outside the 6-12 month window. The Sahm Rule hasn’t triggered yet (unemployment rise below 0.5 points), weakening near-term urgency.
- Mixed Data: GDP growth forecasts for 2025 (e.g., 2.6% full-year) and solid job gains (249,000 monthly average in May 2024) contradict immediate collapse narratives.
3.3 Counterpoints – Strengths :
- Labor Market Resilience: A 4% unemployment rate, consistent job growth, and wage increases outpacing inflation (4.5% vs. 2.5%) provide a sturdy foundation. Pre-recession labor markets typically show sharper deterioration, absent here.
- Consumer Spending Power: Excess savings ($1.5 trillion) and steady retail sales (e.g., strong 2024 holiday spending) suggest households can weather sentiment dips, sustaining 70% of GDP through late 2025.
- Policy Levers: The Fed’s ability to cut rates (potentially 50-100 basis points) and Trump’s fiscal plans (tax cuts, infrastructure) offer proactive buffers, unlike pre-2008 constraints. Goldman Sachs’ 35% odds reflect confidence in these tools.
- Corporate and Sectoral Health: S&P 500 profit growth (7% in 2024, 6-8% projected for Q1 2025) and a stable housing market (no bubble, easing rates) reduce systemic risks, supporting investment and growth into 2026.
3.4 Counterpoints – Weaknesses:
- Vulnerability to Shocks: Tariffs or a sudden unemployment spike could overwhelm these strengths, eroding consumer and corporate confidence faster than policy can respond.
- Over-Optimism: Counterpoints assume smooth policy execution and no major external disruptions (e.g., Middle East conflict spiking oil prices), which may underestimate tail risks flagged by recession models.
3.5 Head-to-Head Evaluation:
- Immediacy: Recession signals like GDP nowcasts and consumer confidence are flashing now, but lack confirmation from real-time triggers like the Sahm Rule. Counterpoints lean on current strengths (jobs, spending) that are tangible and ongoing, giving them a slight edge in the 6-12 month window.
- Predictive Power: The yield curve and consumer expectations have stronger historical track records than labor resilience or policy promises, which can falter under stress. This tilts long-term credibility toward recession arguments.
- Magnitude of Impact: Recession risks amplify if trade wars escalate, a plausible near-term catalyst. Counterpoints rely on stability and gradual policy effects, which may not match the speed of a tariff-driven shock.
- Data Balance: The economy’s mixed signals—growth forecasts vs. sentiment drops—mean neither side has a knockout punch yet. However, counterpoints benefit from observable, positive metrics over speculative downturn risks.
3.6 Verdict: Counterpoints Edge Out (for Now):
The counterpoints narrowly “win the day” within the 6-12 month horizon (September 2025 to March 2026). The US economy’s current resilience—robust jobs, consumer spending, and policy flexibility—outweighs the recession signals’ immediacy, which are potent but not fully crystallized (e.g., no Sahm Rule trigger, yield curve lag). The labor market and household finances provide a buffer that could hold through mid-2025, absent a major shock like tariff implementation or a geopolitical crisis.
However, the recession arguments retain a strong case for a downturn by late 2025 or early 2026, especially if external risks materialize. The counterpoints’ victory is conditional and fragile—watch unemployment trends, Fed moves, and trade policy outcomes in Q2 2025. If those tilt negative, the recession side could reclaim dominance swiftly. For now, resilience trumps warning signs, but it’s a close call.
4. Global Economy Recession signals
Here we examine general, widely available public indictors, prediction markets and expert models warning of global recession. Several global economic indicators and models are signaling an elevated risk of a global recession within the next 6-12 months (i.e., by September 2025 to March 2026). Below is an overview of the key indicators and models currently pointing to this possibility, based on recent economic analyses and data:
4.1 Inverted Global Yield Curves:
Globally, the inversion of yield curves—where short-term interest rates exceed long-term rates—remains a potent recession signal. For instance, the US 10-year minus 3-month Treasury spread, a benchmark influencing global markets, has re-inverted in early 2025, reflecting expectations of economic slowdown. Similar patterns are observed in other major economies like Germany and the UK, where yield curve inversions have historically preceded recessions by 12-18 months. This suggests a potential global downturn could emerge by late 2025 or early 2026, driven by tighter monetary policies and weakening investor confidence.
4.2 OECD Composite Leading Indicators (CLI):
The Organisation for Economic Co-operation and Development (OECD) tracks leading indicators across its 38 member countries. Recent CLI data (as of May 2024, per S&P Global) shows a downward trend in several advanced economies, particularly in manufacturing and new orders, signaling a loss of economic momentum. While not yet at recessionary levels across all regions, the CLI’s softening in Europe and parts of Asia (e.g., Japan) raises concerns about a synchronized global slowdown within the next year, especially if trade disruptions intensify.
4.3 Global PMI (Purchasing Managers’ Index):
The J.P. Morgan Global Manufacturing PMI has hovered near or below the 50 threshold (indicating contraction) in recent months, with February 2025 data reflecting weakness in export orders due to anticipated US tariffs under the Trump administration. A sustained drop below 50, particularly if services PMIs follow, could foreshadow a recession by Q3 2025, as manufacturing often leads broader economic cycles. Europe’s PMI, especially in Germany, is already in contraction territory, amplifying global risks.
4.4 Consumer Confidence Declines:
Globally, consumer confidence is waning, a critical indicator given that consumption drives much of economic activity. In the US, the Conference Board’s Consumer Confidence Index fell sharply in February 2025 (to 98.3), with expectations dropping below 80—a recessionary signal. Similar declines are noted in Europe (e.g., Eurozone Consumer Confidence at -14.8 in early 2025) and China (post-COVID recovery stalling). If this pessimism curbs spending further, a global recession could materialize by late 2025, as seen in past downturns like 2008.
4.5 Prediction Markets and Expert Models:
Polymarkets’ global recession odds for 2025 stand at 41%, up from earlier estimates, reflecting trader bets on policy shocks like US tariffs (25% on Canada/Mexico, 20% on China). J.P. Morgan’s global recession probability rose to 40% for 2025 (from 35%), citing trade war risks and slowing US/China growth. The World Bank’s January 2025 “Global Economic Prospects” warns of a 2.7% global growth rate in 2025—near recessionary levels if downside risks like trade policy shifts or energy price spikes materialize. Bloomberg Economics pegs a 38% chance of a US-led global slowdown, factoring in consumer and trade data.
4.6 IMF and World Bank Warnings:
The International Monetary Fund (IMF) projects global growth at 3.3% for 2025 (March 2025 World Economic Outlook update), but flags downside risks from escalating conflicts (e.g., Middle East), tighter financial conditions, and trade fragmentation. A drop below 3% is often a recession precursor, and their alternative scenarios suggest a 2.5% growth rate if trade tensions worsen—possible by Q4 2025. The World Bank echoes this, highlighting policy uncertainty and climate shocks as triggers for a downturn within 12 months.
4.7 Trade and Commodity Signals:
The Baltic Dry Index, a measure of global shipping demand, has softened in early 2025, hinting at reduced trade activity amid tariff threats. Commodity prices, particularly oil, are volatile due to OPEC+ cuts and geopolitical tensions, with potential spikes risking stagflation—a recessionary condition last seen in the 1970s. Copper prices, a bellwether for industrial activity, have also trended lower, signaling weaker global demand by mid-2025 if current trajectories hold.
4.8 Context, Caveats & Summary:
- Timing Uncertainty: Indicators like yield curves and PMIs often lead recessions by 6-18 months, placing the risk window between late 2025 and early 2026. Consumer confidence and trade signals, however, can accelerate this timeline if shocks intensify.
- Regional Divergence: Europe and China face higher immediate risks (e.g., Germany’s industrial slump, China’s property sector woes), while emerging markets like India (6.2% growth forecast) may offset some global weakness—delaying but not preventing a broader recession.
- Policy Shocks: Trump’s tariff proposals and potential retaliatory measures from trading partners (e.g., EU, China) are wildcard factors. J.P. Morgan notes a possible 10-point tariff hike could slash global growth by 0.5%—enough to tip the scales by Q3 2025.
- Summary : Inverted yield curves, declining OECD CLIs, weakening PMIs, falling consumer confidence, and elevated model probabilities from J.P. Morgan, Polymarket, and the World Bank are key global indicators pointing to a recession risk within 6-12 months. The interplay of trade policy shocks and regional vulnerabilities heightens this likelihood, though robust pockets of growth could still avert a full downturn. Watch PMI trends, OECD CLI’s and trade developments in Q2 2025 for clearer signals.
5. Global Economy Expansion signals
Here are important counterpoints specific to the global economy that argue against a recession within the next 6-12 months (i.e., by September 2025 to March 2026). These factors highlight resilience and could offset some of the recessionary signals previously outlined:
5.1 Emerging Market Growth Momentum:
Economies like India and Southeast Asia are projected to grow robustly, with India’s GDP forecast at 6.2% for 2025 (per IMF) and ASEAN countries averaging 4-5%. These regions, less exposed to US tariff risks, are benefiting from manufacturing shifts away from China and strong domestic demand. Their buoyancy could offset slowdowns in advanced economies (e.g., US, Europe), stabilizing global growth through late 2025.
5.2 Global Services Sector Strength:
While manufacturing PMIs signal contraction (e.g., J.P. Morgan Global Manufacturing PMI near 50), the services sector—comprising over 60% of global GDP—remains resilient. In the US, Eurozone, and parts of Asia, services PMIs are holding above 50 in early 2025, driven by digital transformation and consumer spending. This resilience could delay a full recessionary slide into 2026, cushioning weaker industrial activity.
5.3 Central Bank Adaptability:
Major central banks (Federal Reserve, ECB, Bank of Japan) have signaled willingness to ease monetary policy if growth falters. With global inflation cooling (e.g., 3% average in OECD countries), rate cuts in 2025—potentially 50-75 basis points by Q3—could stimulate investment and consumption. The ECB, for instance, has room to act as Eurozone inflation nears 2%, offering a buffer against recession risks through mid-2025.
5.4 Energy Market Stability:
Despite geopolitical tensions, oil prices remain manageable ($70-80/barrel in early 2025), thanks to OPEC+ coordination and US production. This avoids the energy price shocks that fueled past global downturns (e.g., 1970s stagflation). Stable energy costs support industrial activity and household budgets, potentially sustaining growth into Q1 2026.
5.5 Corporate Cash Reserves:
Globally, corporations have amassed significant cash reserves post-COVID, with S&P Global 500 firms holding over $7 trillion in liquid assets by late 2024. This financial cushion—bolstered by profit growth (e.g., 7% in the US)—enables firms to weather trade disruptions or demand dips, maintaining investment and hiring through late 2025 and reducing systemic risk.
5.6 China’s Policy Stimulus:
China, the world’s second-largest economy, is rolling out fiscal and monetary measures to counter its property sector slump and boost growth (projected at 4.5% for 2025 by the World Bank). Infrastructure spending and consumer incentives could stabilize its economy, a key driver of global demand, preventing a sharper downturn by Q3 2025.
5.7 Trade Adaptation:
While US tariffs (e.g., 25% on Canada/Mexico, 20% on China) pose risks, global supply chains have shown adaptability since COVID. Firms are diversifying sourcing (e.g., Vietnam, India) and boosting regional trade (e.g., EU-Mercosur talks advancing). This flexibility could mitigate tariff impacts, keeping global trade flows intact through mid-2025 and averting a recession trigger.
5.8 Context, Caveats & Summary:
These counterpoints emphasize the global economy’s diverse strengths: growth in emerging markets, a robust services sector, policy flexibility, and adaptive capacity. They align with optimistic outlooks like Goldman Sachs’ lower recession odds (35% for the US, with global implications) and contrast with gloomier signals like inverted yield curves or declining PMIs. Their effectiveness depends on execution (e.g., timely stimulus, trade rerouting) and avoiding major disruptions (e.g., Middle East escalation spiking oil prices). If these hold, they could push recession risks beyond March 2026.
In summary, emerging market resilience, services strength, central bank agility, energy stability, corporate buffers, China’s stimulus, and trade adaptability provide a compelling case against a global recession in the next 6-12 months. These factors could sustain growth—or at least delay a downturn—into 2026, barring significant shocks. Monitor services PMIs, China’s policy outcomes, and trade data in Q2 2025 for confirmation of this resilience.
6. Global Economy Head-to-Head
Determining whether the global recession arguments or the counterpoints “win the day” within the next 6-12 months (i.e., by September 2025 to March 2026) requires a head-to-head evaluation of their strength, immediacy, and reliability. Here’s the analysis in the same format as provided for the US economy:
6.1 Recession Arguments – Strengths:
- Historical Reliability: Inverted yield curves in major economies (e.g., US, Germany, UK) have consistently foreshadowed global recessions with a 12-18 month lead time. Their presence in early 2025 points to a potential downturn by late 2025 or early 2026.
- Consumer Sentiment Drop: Declines in consumer confidence across key regions—US (Expectations Index at 72.9), Eurozone (-14.8), and China (post-COVID stall)—signal reduced spending, a critical driver of global GDP. This pessimism could accelerate a slowdown by Q3 2025.
- Model Consensus: J.P. Morgan (45%), Polymarket (41%), and Bloomberg Economics (38%) converge on heightened recession odds within 12 months, amplified by trade policy risks (e.g., US tariffs) and weakening PMIs (global manufacturing near 50).
- External Risks: Escalating trade tensions (e.g., 25% US tariffs on Canada/Mexico, 20% on China) and geopolitical flashpoints (e.g., Middle East) could disrupt supply chains and spike commodity prices, triggering a synchronized global downturn by mid-2025.
6.2 Recession Arguments – Weaknesses:
- Timing Uncertainty: Yield curve inversions and PMI declines often precede recessions by up to 18 months, potentially pushing the downturn beyond March 2026—outside the 6-12 month window. Immediate triggers like a sharp PMI drop below 50 across services haven’t materialized yet.
- Mixed Data: Global growth forecasts (e.g., IMF’s 3.3% for 2025) and resilience in emerging markets (e.g., India at 6.2%) suggest the economy isn’t in freefall, diluting the urgency of recession signals.
6.3 Counterpoints – Strengths :
- Emerging Market Resilience: India (6.2% growth) and ASEAN (4-5%) provide a counterweight to advanced economy slowdowns, sustaining global demand and trade flows through late 2025.
- Services Sector Strength: Global services PMIs above 50 (e.g., US, Eurozone) underpin over 60% of GDP, offering a buffer against manufacturing weakness and potentially delaying recession into 2026.
- Policy Levers: Central banks (Fed, ECB, BoJ) have room to cut rates (e.g., 50-75 basis points by Q3 2025), while China’s stimulus (infrastructure, consumer incentives) could stabilize its 4.5% growth, supporting the global economy through mid-2025.
- Corporate and Trade Buffers: $7 trillion in corporate cash reserves and supply chain adaptability (e.g., shifts to Vietnam, India) reduce vulnerability to trade shocks, maintaining economic activity into Q1 2026.
6.4 Counterpoints – Weaknesses :
- Vulnerability to Shocks: A rapid escalation of tariffs or an energy price surge (e.g., Middle East conflict) could overwhelm these strengths, hitting trade-dependent economies and consumer budgets faster than policy can respond.
- Over-Optimism: Counterpoints assume effective policy coordination and no major geopolitical disruptions, underestimating tail risks like those flagged by recession models (e.g., World Bank’s 2.7% downside scenario).
6.5 Head-to-Head Evaluation :
- Immediacy: Recession signals like weakening PMIs and consumer confidence are active now, but lack a definitive global trigger (e.g., services PMI collapse). Counterpoints draw on current strengths (services, emerging markets) that are measurable and ongoing, giving them a slight edge in the 6-12 month window.
- Predictive Power: Yield curves and consumer sentiment have a stronger track record of signaling global downturns (e.g., 2008) than services resilience or emerging market growth, which can falter under systemic stress. This tilts long-term credibility toward recession arguments.
- Magnitude of Impact: Recession risks escalate quickly if trade wars or commodity shocks hit, outpacing the gradual stabilizing effects of policy or corporate buffers. This gives recession arguments an edge in potential severity.
- Data Balance: Mixed signals—global growth forecasts vs. trade risks—mean neither side dominates fully. Counterpoints, however, leverage tangible positive trends over speculative risks, offering a near-term advantage.
6.6 Verdict: Counterpoints Edge Out (for Now)
The counterpoints narrowly “win the day” within the 6-12 month horizon (September 2025 to March 2026). The global economy’s current resilience—emerging market growth, services strength, policy flexibility, and adaptive trade—outweighs the recession signals’ immediacy, which are compelling but not yet conclusive (e.g., no widespread PMI collapse, yield curve lag). These buffers could sustain growth—or at least postpone a downturn—through mid-2025, barring a major shock like tariff escalation or geopolitical crisis.
That said, the recession arguments hold a potent case for a downturn by late 2025 or early 2026, especially if external risks intensify. The counterpoints’ edge is tenuous and hinges on stability in trade and energy markets. Watch global PMIs, China’s stimulus impact, and US tariff rollout in Q2 2025. If these turn negative, the recession side could swiftly take over. For now, resilience prevails, but it’s a tight race.
7. Summary of public data
In this analysis, we evaluated the likelihood of a recession within the next 6-12 months (September 2025 to March 2026) for both the US and global economies, as of March 31, 2025, by examining key public indicators and models predicting a downturn against counterpoints highlighting resilience. For the US, recession signals like an inverted yield curve, declining consumer confidence, and elevated model probabilities (e.g., J.P. Morgan at 40%) were weighed against robust job growth, consumer spending, and policy flexibility, with counterpoints edging out due to current economic strength. Globally, recession warnings from yield curves, weakening PMIs, and trade risks were pitted against emerging market growth, services sector strength, and central bank adaptability, with counterpoints again prevailing narrowly due to ongoing resilience. Each evaluation included a head-to-head comparison of strengths, weaknesses, immediacy, and predictive power, concluding that while recession risks loom—especially if trade or geopolitical shocks hit—the US and global economies’ buffers provide a slight edge against an imminent downturn, though the situation remains fluid and warrants close monitoring over the next few quarters.
8. The RecessionALERT data
In this section we will observe key non-public proprietary metrics from RecessionALERT to complement the public view in sections 1 through 7.
8.1 Recession Concerns
We can confirm that concerns about a US recession are on the rise again, noting however that it is isolated to the “recession” search term on Google and not the other search terms that have historically accompanied a genuine recession or wholesale recession scare such as 2022. However as this search term dominates in the search volume rankings of the group, it has had the effect of raising the volume-weighted average considerably for the month of March:
8.2 The US Coincident data
The NBER Big-Six coincident indicator shows a US economy that weakened considerably in 1Q2023, narrowly missing recessionary levels, but has since recovered and actually appears on the mend:
8.3 The Trade Volume Data
U.S (and global) trade volumes look surprisingly robust and support the view of a healthy current economy. Both appear to be actually going parabolic:
Given the massive jump the US is showing recently, one cant but help wonder if this jump is due to the gold imports issue that is being fingered for depressing the Real GDPNow forecast. Indeed this appears to be the case:
Ignoring this anomaly, trade volumes in the US are nonetheless on the climb.
8.4 The Industrial Production Data
Global industrial production seem unfazed:
..but the US data is moribund:
8.5 The GDP Data
The worlds 41 largest economies, accounting for over 95% of global GDP, are on the mend after a 3Q2023 slump, most likely the depth of a global recession (not yet declared by OECD by coinciding with the US slump at the time). Another coincident (actually GDP is slightly rear-view) metric showing world economy on the mend.
US GDP & GDI combined data is nowhere near recessionary levels but 1Q2025 will be an interesting print given the GDPNow forecasts skewed with the gold imports. Our combined GDP/GDI model (GDPI) in black below is compared to the Philadelphia FED GDP Plus model:
8.6 The U.S Leading economic data
The higher frequency Weekly Leading Economic Index (WLEI) and the pseudo-weekly SuperIndex are showing a non-trivial weakening of late. It should be noted that whilst the WLEI entered expansion territory around mid-2023, with strong future growth signalled all the way to late 2024 before declining again, the SuperIndex has yet to raise its head above water. The Weekly Leading Aggregate (WLA) which is just the average of these two is now flirting with the recessionary warning line.
The 23 factor US Monthly Leading Economic Index (USMLEI), from which we derive 5 different probability models for recession (and focus on the top-2 probabilities) has also failed to keep head above water for longer than a 2-month stint, with over 61% of its 23 components still in recession territory. This is a story being witnessed among many other monthly leading indices such as the Conference Board one. Whilst they showed things getting much less worse from about mid 2023 they never quite reached the “things are getting better” situation. The Top-2 probabilities are now hovering around the 45% mark, very similar to other figures we saw in section 1.5 at the beginning of this report.
8.7 The Global Leading Economic Data:
Lets look at the leading global data, picked from our monthly Global Economic Report. One of the most widely followed metrics among our clients is the percentage of G20 countries with rising “headline” LEI indices (the actual indices, not the growth metrics.) This is popular due to its high correlation to US stock market movements with an 8-month lead, as shown below. This correctly signaled a boom in US stocks from 1Q2023 to this day and suggests further upside for US stocks:
This is one of the more bullish indicators right now since this correlation to future 8-month US stocks movements extends to US economic data too – effectively giving us a “leading indicator for the US leading data” or in mathematical terms “a 2nd-deriviative” for the USMLEI or in economic terms, “a long-leading indicator for US economic conditions“. This is also suggesting a strong tailwind for the USMLEI and other such variants such as the Conference Board LEI:
There is a caveat to this bullish metric though. If we examine its 1st derivative, namely the percentage of G20 countries with rising LEI growth metrics (based on six month smoothed growth of the headline LEI for each country) we see some cause for caution as this breadth metric is not only slowing, but it has gone “negative” (below 50%). This tells us that these headwinds are at high risk of petering out since the 1st derivative is a “leading indicator” for 3-4 month future direction of the %G20 with rising LEI metric:
On the topic of global leading data, another important leading indicator is the breadth of global central bank monetary policy easing, as measured by the % countries with falling interest rates. This has maximum correlation with US leading economic data (USMLEI) when pushed a full 12 months into the future, maximum correlation with annual US stock returns when pushed 10 months into the future and maximum correlation with the global manufacturing PMI when pushed 8 months into the future:
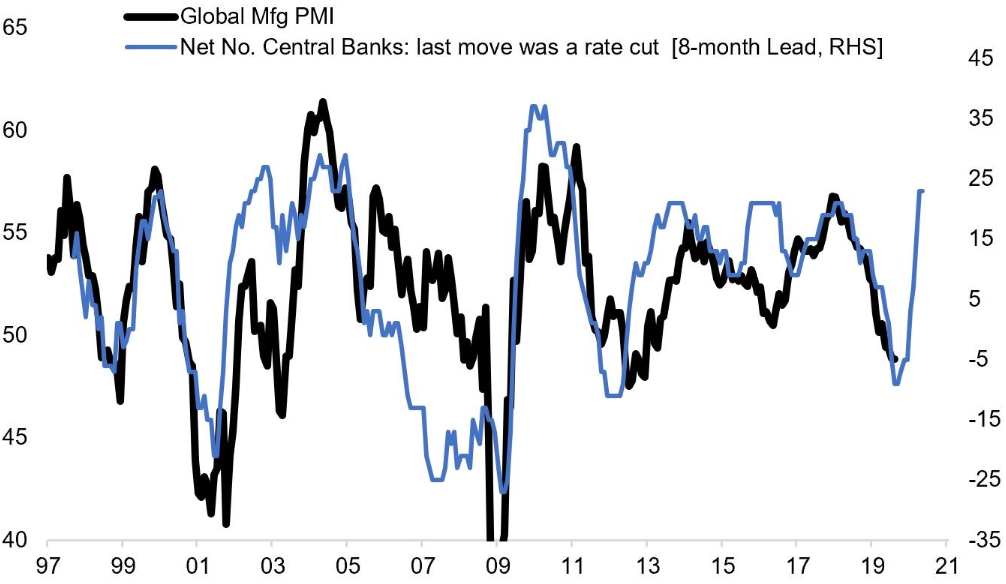
So for now, global monetary policy and % OECD countries with rising LEI’s are strongly suggesting future growth ahead for the global economy and US stocks for the next 6-8 months.
8.8 Composite Market Health Index (CMHI).
One of the more interesting indicators we developed and introduced many moons ago is the CMHI (see initial launch and subsequent improvements.)
Although this was initially developed to measure “health” of the US stock market, it also was adept at signalling warning of recessions and associated bear markets.
A short history is shown below, but the indicator has working historical data and successful warning of all US recessions going back to 1968:
Whilst this model does not produce probabilities of recession like our purpose built recession models, it does provide for fantastic high confidence “new bull market signals” (the green circled dots) and a vulnerability warning when it drops below the regression trend of 0.319 and a more decisive warning when it drops below zero. As we can see we have had the first warning in March from the monthly version above as it fell below the long-term regression trend. The daily published version (DCMHI) provided warning on 13 March 2025 and the weekly version (WCMHI) on week ended 14 march 2025. The OPT-CMHI trading regimen built around CMHI went to cash on 13 Jan 2025.
8.9 The US Labor Data
The coincident US labor data remained the “last man standing” when all the leading data tanked in 2023. As seen at the beginning of this note in section 1, it is often cited as a counter to more bearish data. The most watched metric by far for the last 18 months has been the “Sahm rule” (which uses the unemployment rate) which although flagging recession in July and Aug 2024, the author of the indicator claimed immigration as the cause for unemployment rising and as a reason to ignore the signal. At the time she made this statement, we published a research paper titled “The SAHM Rule Redux” where we looked at more varied, efficient, accurate, timely and robust interpretations using alternate models and even state and metro level employment data.
Lets have a look at what they are saying as at December 2024 (subscribers get get later data in the Monthly Charts section):
The original SAHM rule is the black line having risen above the 0.5 trigger for 2 months. We see clearly that the Metro (blue line) and State-level (red line) versions were painting a far worse picture with much earlier warning, around the time all the other leading economic data tanked, dragging all the monthly leading economic indices into recession territory. Our preferred interpretation, the “Cycle Low” SAHM in yellow signaled recession 1 month before the original SAHM and remains in recession territory:
In addition to maintaining the SAHM and its derivates for subscribers, we also maintain the US Cyclically Sensitive Labor Market Index (CSLMI) – an equally weighted growth index of 8 monthly updated labor market components that are highly cyclically sensitive to the labor market and U.S business cycle. These are thus typically labor components that turn down 8-months before the traditional labor market defined by the widely used national unemployment rate and U.S non-farm payrolls. It is thus a leading labor market index:
Whilst never quite entertaining a visit below the “Always recession below this line” and remaining in the “Soft Landing zone” the visitation below zero was rather extended at 30 months and remains below zero despite recent attempts at a sluggish recovery.
In conclusion, whilst payroll employment, the main labor indicator used by the NBER in its recession declaration models appears robust, just about everything else labor related appears downright vulnerable.
8.10 The Recession Forecast Diffusion (RFD)
We maintain 15 economic and recession models specialising is labour, housing, and coincident, short-leading, medium leading and long leading generic composites. The charts below show a diffusion counting what percentage of these 15 models are in their respective recession warning territories as at March 2025:
We can see a large jump in March as 4 models fell back into their respective recession territories, taking the total to 10 models in recession. If we imply a recession probability from this chart we can say that US recession odds climbed from 40 to over 66% in March 2025.
8.11 Yield Curve Inversion
After a near universal yield curve un-inversion on week ended 10 Jan 2025, yield curves have started inverting again. Currently 50% of 28 treasury yield curves are inverted, with it touching 60% (the suggested recession trigger) on week ended 21 Mar 2025. Assuming the percentage of yield curves inverted as a proxy for odds of recession mean we are at 50-60% odds of recession:
8.12 Summary of RecessionALERT data
Section 8 presents a mixed picture. Global indicators suggest recovery and growth potential into mid-2025, supported by rising LEIs and monetary policy easing. However, U.S.-specific data reveals vulnerabilities, with weakening leading indicators, inverting yield curves, stagnant industrial production, and labor market fragility, despite robust payrolls and non-recessionary GDP levels and coincident NBER model. The analysis hints at a cautious outlook, with recession risks present and over 50%, but not yet dominant. With mixed pictures come uncertainty – and markets dont like uncertainty. With this in mind, we have to take cognisance of the fact that we have entered a new period of “expanding volatility” that is likely to persist for a while:

9. Summary
Despite these concerns, the Composite Market Health Index and global trade volumes offer some optimism, not yet confirming an imminent recession. For the U.S., payroll strength, global monetary policy and bullish global LEI correlations support potential stock market gains over the next 6-8 months, though the balance of resilience and vulnerability keeps recession odds above 50% but not yet dominant.
The close to call negatives versus positives and > 50 probabilities of recession paints a mixed picture which will cause uncertainty and more volatility in the stock market.
Comments are closed.