
A raft of analysts, perma-bears and bloggers are playing fast and loose with the R-word again. This is likely to reach a crescendo with the release today of the unexpected large drop in the ISM non-manufacturing survey. We recall a time in late 2011 when the mainstream perception was that we were headed for recession and we posted a widely read article that went against the mainstream, and attracted attention of some respected names:
Given the amount of attention looming recession calls are getting, we thought it prudent to throw our observations into the hat.
The main reasons for most parties claiming we are in recession are the SP-500 earnings recession, stock markets, the widening credit spreads, Weekly Leading Indicators and Industrial production/Manufacturing. Next week, see the articles about the ISM non-manufacturing PMI crawl out the woodwork. Let’s look at each of these in turn.
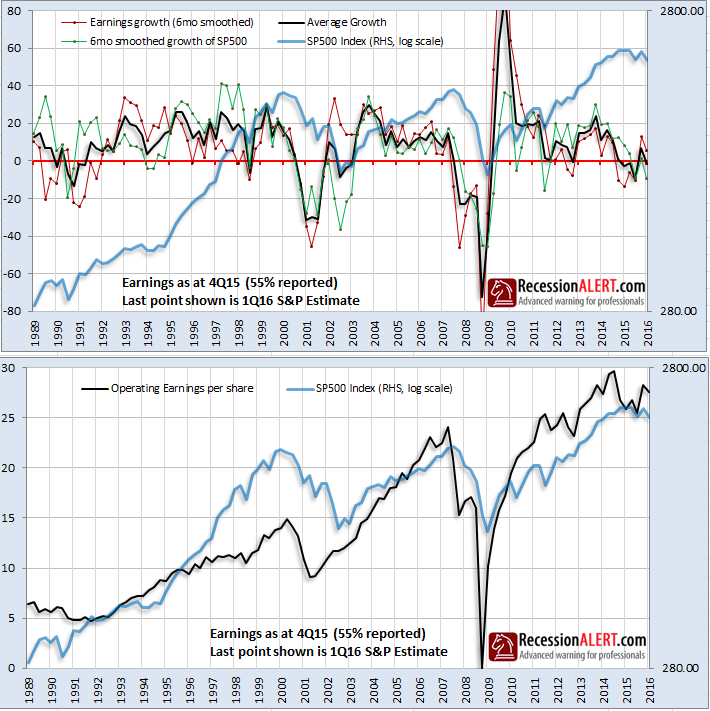
The SP-500 earnings are indeed in recession and this is normally a strong predictor of economic recession and bear markets:
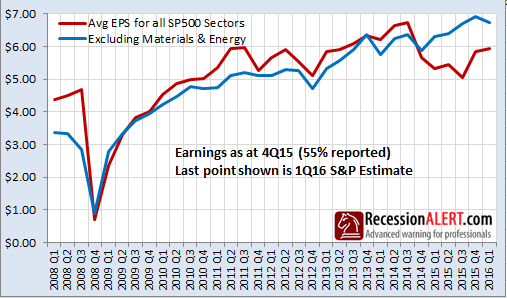
However, if you dig under the hood, the earnings recession is mostly a function of the hammering taken by the Energy and the Materials sectors. It is debatable if these sectors make up enough of the economy to drag it into recession:
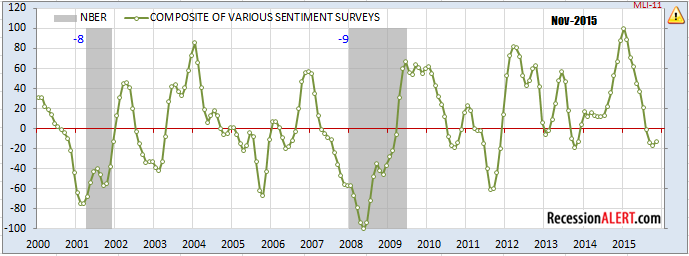
The stock markets are indeed pricing in recession, as shown with the Stock Market Composite of economically sensitive stocks which is one of the components of our Weekly Leading Economic Index (WLEI):
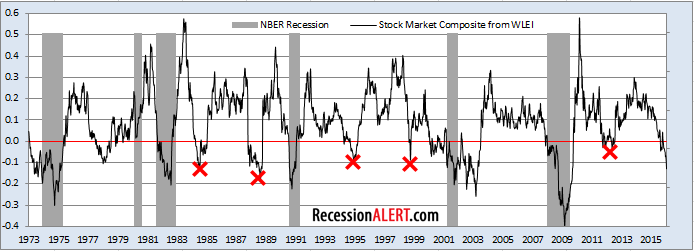
However, we all know the story about the stock market predicting 12 of the last 6 recessions with the false alarms shown above.
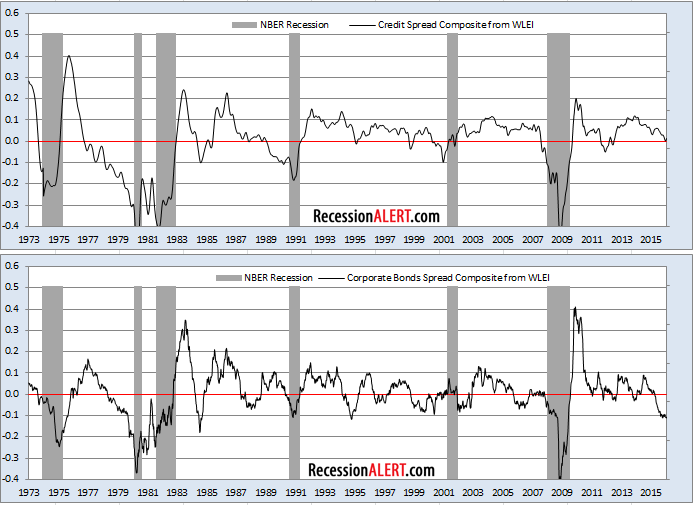
Third up is a favorite of the bears, namely widening Credit Spreads. Whilst corporate bond spreads (WAAA/WBBB, -WBBB and T-Bill/BBB) are indeed flagging emphatic recession (bottom chart in the pair below), when one views a very broad basket of over 35 credit spreads (top chart below), the picture is far less bearish (albeit at concerning levels). The top chart is updated weekly and is also a component of our Weekly Leading Economic Index (WLEI)
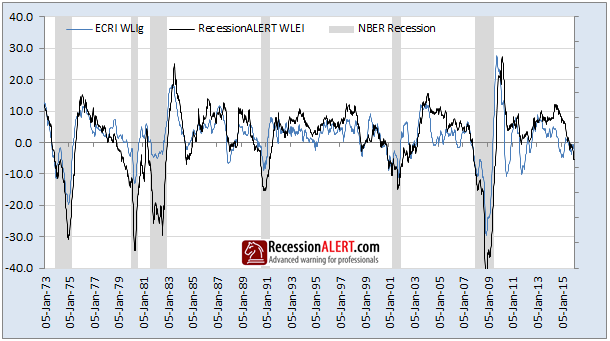
The widely followed ECRI Weekly Leading Index also is flagging recession, but it has done so three times already this expansion. Whilst our own WLEI has not flagged an alert before 21/08/2015, it now joins the ECRI WLI in an emphatic recession call.
Weekly leading indicators are much noisier than monthly ones so one would observe several weeks of recession signal before reading anything into it. This wait period has passed and so we need to determine the possibilities. Our Weekly Index, which is published for subscribers every Thursday evening, consists of 5 groups of composites covering corporate & treasury bonds, stock markets, employment and credit spreads and is made up of just over 100 weekly time series:
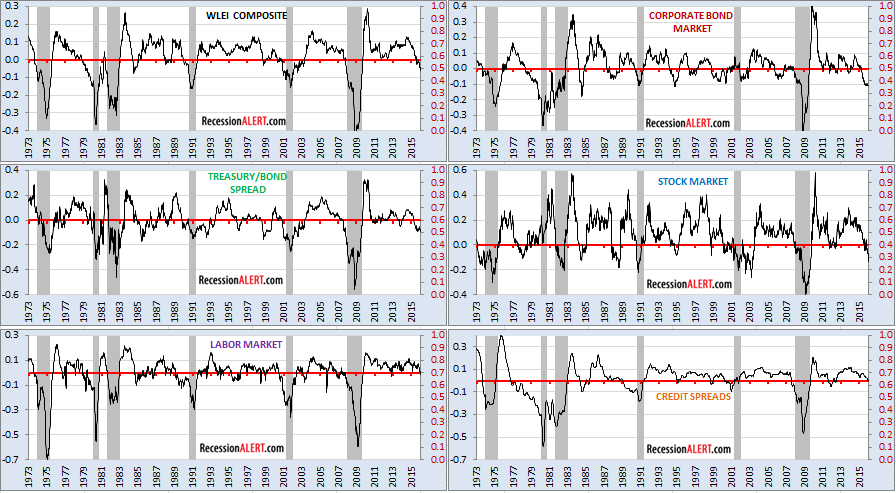
The WLEI is negative now because of the heavy weighting (60%) made up of the Corporate Bonds composite, the Treasury/Bond composite and the Stock Market composite. As we have warned subscribers in the past, we do not believe the 5 major categories above may be broad enough to properly encapsulate all manner of recessions and we are on the hunt for a sixth that also only contains weekly data of a short-leading nature (we do not believe in mixing long leading indicators with a short leading system nor mixing monthly time series with weekly ones.)
Also note from the first chart above that there have been 3 false alarms since 1973 with the depth of the current readings consistent with the 1984 false alarm. Thus, whilst the WLEI flags caution we do not use it for performing actual stock market actions at this point.
The fifth item hauled out the bag to argue for recession is Industrial Production which is indeed in recession. Unlike past declines in industrial production, the current decline has been driven primarily by the collapse in the utilities industry (weather) and mining (impacted by energy) which make up just 25% of Industrial Production.
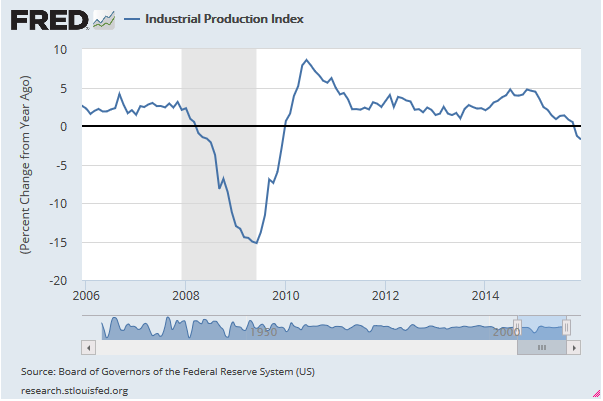
During 1985/6, declining oil prices and a rapidly rising dollar also led to an Industrial Production slump. This did not turn into a recession. There is a great piece on this here.
Now we move onto Manufacturing which makes up about 70% of Industrial Production and 12% of US GDP. The output from U.S. factories has been little changed recently, although the main manufacturing indicator being watched, the ISM PMI composite, is indeed below the expansion level of 50. In the last few decades, it was not unusual for the ISM to signal recession as the broader economy remained in expansion.
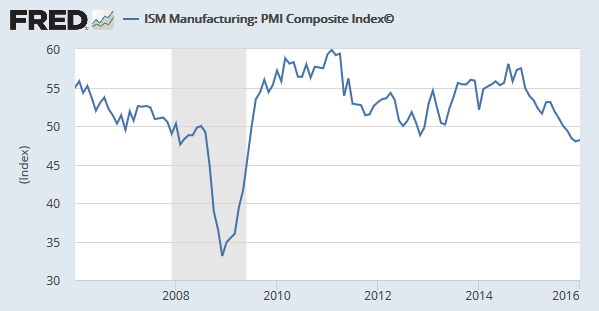
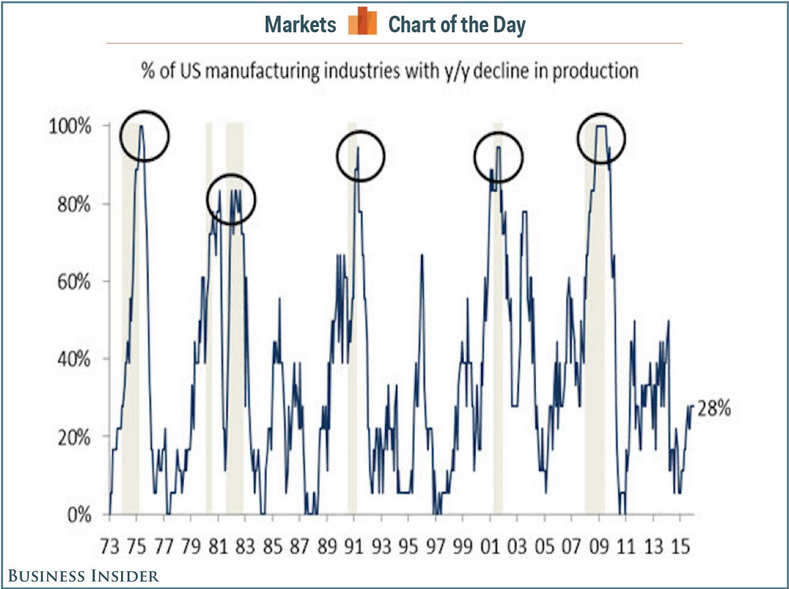
The real rebuttal against the ISM Manufacturing PMI warning is highlighted by Tom Porcelli at RBC Capital Markets who stated “One of the reasons to believe the so-called manufacturing ‘recession’ is likely to be short-lived is that it has been limited to a handful of industries. In other words, it has not been a pervasive slowing.” There is nice coverage on this at Business Insider.
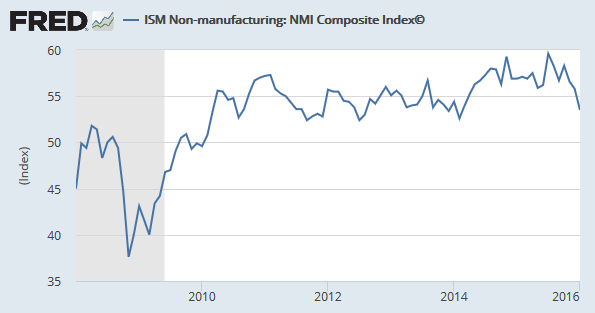
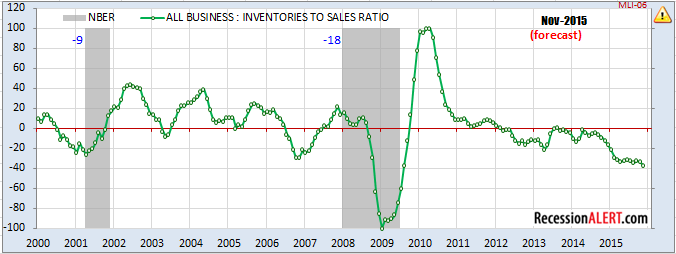
Lastly, lets cover the latest candidate to be trotted out in ensuing days. Non-manufacturing (a large chunk of the economy) is weakening, with an unexpected downturn on the latest reading, the biggest one-month decline since the recession. But it will require another two such drops to get to contraction territory:
We know that manufacturing is about 12% of the US economy (red line below). We also know that the manufacturing and the non-manufacturing sectors together make up 90% of the US economy. This means non-manufacturing (green line below) makes up 78% of the economy. We can combine these two according to their relative weights to give a representation of 90% of the US economy as at January 2016:
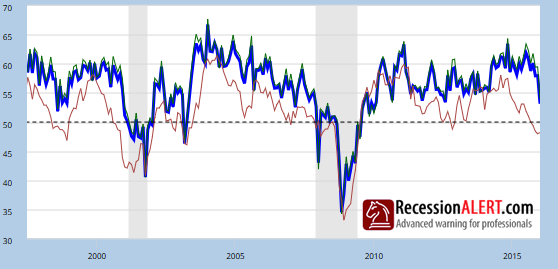
There was a disconcerting plunge in January, but no recession signal yet.
Now lets focus on the arguments AGAINST recession.
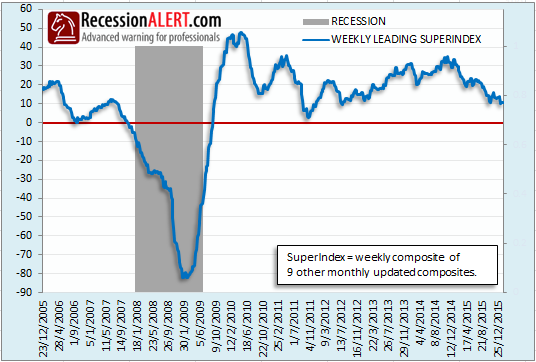
Firstly, our own Monthly Leading SuperIndex, a very broad indicator used in Jan 2012 to dispute recession mania, is weakening, but not flagging recession:
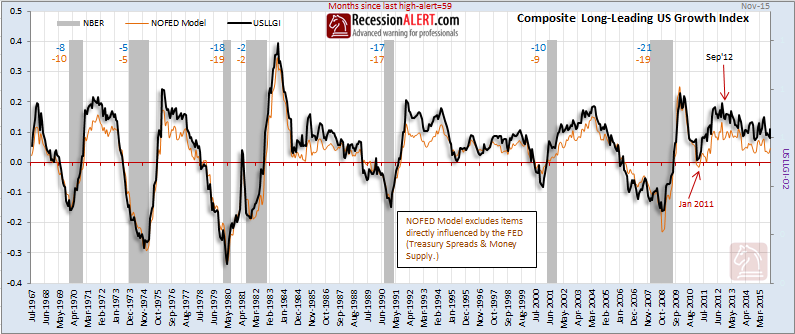
Secondly, there are precious few long-leading indicators flagging recession. Until we find long leading data (except of course corporate profits and corporate bond spreads) that concurs with future recession, we will have difficulty raising red flags on the economy. Our own long-leading indicator, USLLGI, tracks the growth of 8 reliable indicators which have consistently peaked 12-18 months before the onset of NBER defined recessions since the early 1950’s :
The National Buro for Economic Research (NBER) are the final arbiters of recession dating in the U.S. The NBER does not define a recession in terms of two consecutive quarters of decline in real GDP. Rather, a recession is a significant decline in economic activity spread across the economy, lasting more than a few months, normally visible in real GDP, real income, employment, industrial production, and wholesale-retail sales.
They will be examining 4 monthly co-incident indicators:
- Industrial Production
- Real personal income less transfers deflated by personal consumption expenditure
- Non-farm payrolls
- Real retail sales deflated by consumer price index
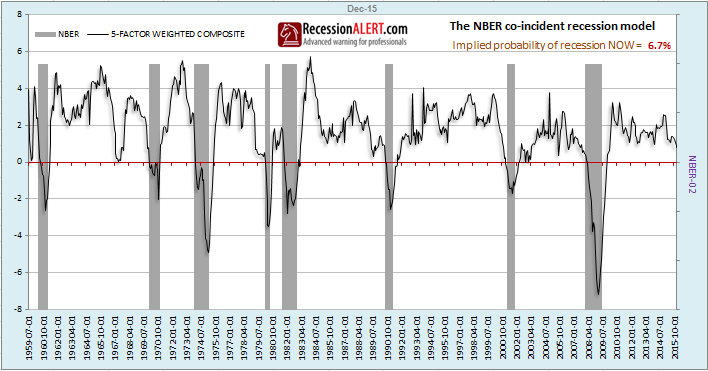
We used the above 4 indicators to create a “NBER Big-Four” composite index many moons ago. It is also showing disconcerting sluggishness, but no immediate signs of recession:
There are however some short-leading indicators not often mentioned that warrant concern. Here are some taken from our Monthly Long Leading Composite Index:
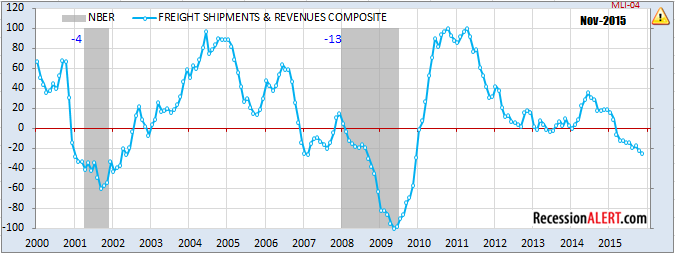
..and here is one to watch closely:
To summarize, despite many pockets of disconcerting co-incident indicator weakness, many brought on by the energy and commodities complex, the risk of near-term recession appears low. Although many short-leading indicators are showing recession there are not enough of them yet to warrant a confident recession call. What remains highly elusive is finding long-leading data that points to recession.
Recession odds are rising, as is commentary surrounding recession. Most of this commentary centers around “cherry picking” this or that indicator or sector to bolster an argument but rarely covers broad-based assessments. One thing is for certain – watching co-incident, short and long leading data closely is going to be back in vogue over the coming months:
Just like 2011/12 it is going to make for some interesting times.