
The strength of the labor market is constantly being trotted out in defense of the robust status of the US economy, but broad sets of labor data show this not to be the case.
First, let us examine a very broad US labor market growth metric:
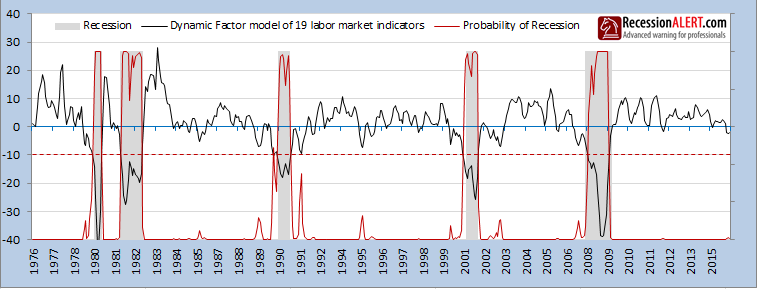
This indicator needs to fall below -10 before the odds of recession skyrocket to a near certainty and so whilst there is no cause for immediate alarm, it is clear the indicator is not exactly shooting the lights out and has probably peaked. As it is a leading indicator, it is telling us that further gains in the labor market are likely to be muted going into Summer.
Another useful broad Labor market indicator is the Conference Boards’ Employment Trends Index (ETI):
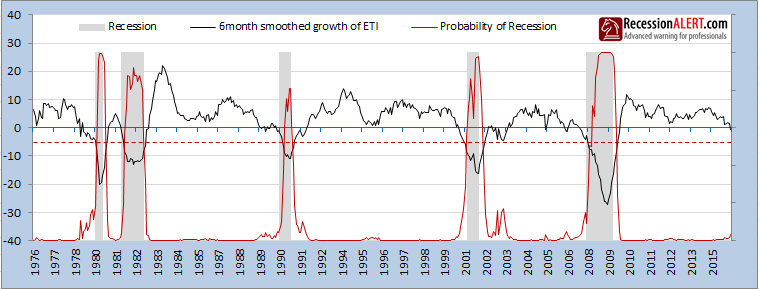
This indicator needs to fall below -5 before the odds of recession skyrocket to a near certainty and whilst there is no cause for immediate alarm, it is clear the indicator is not exactly shooting the lights out either and has definitely peaked. As it is a leading indicator, it is also telling us that further gains in the labor market are likely to be muted going into Summer.
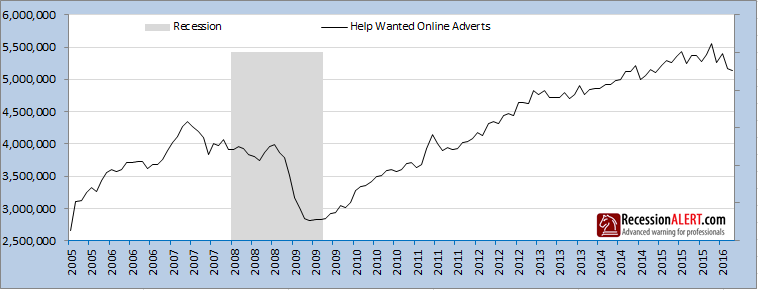
The Conference Board also publish a “Help Wanted Online” (HWOL) index, that tracks Online advertised vacancies. Whilst the data has a much shorter history, it clearly peaked well before the 2008 Great Recession and has most certainly peaked in mid 2015:
The US Civilian Unemployment Rate is often used to talk up the status of the labor market:
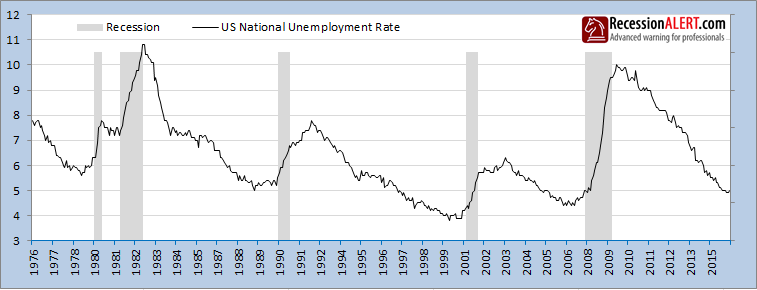
This indicator has a long term history going back much further than that shown and is a reliable indicator of recession when it starts rising, although it is a co-incident and not a leading indicator. Whilst it appears to have leveled out recently, it certainly shows no cause for immediate alarm and cannot even be categorized as having peaked as with the other three indicators we showed.
However if we dig a little deeper and measure the percentage of 52 U.S states with an increasing civilian unemployment rate, things become a little less flattering:
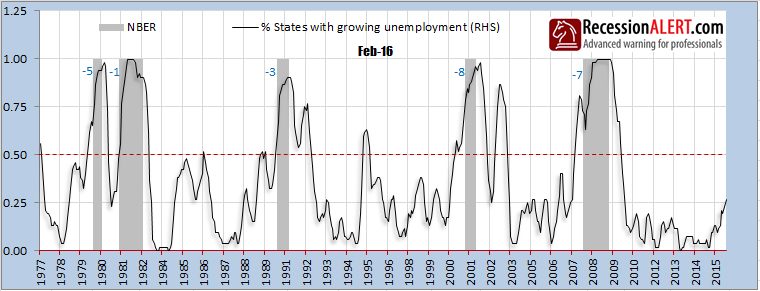
Over 25% of the 52 US States now have rising unemployment, a record for the current expansion. Again, nothing to be alarmed about until this measure gets to over 50% (where it serves as a leading indicator of recession) but you have to agree it is far less flattering than the national unemployment rate measure would have you believe and has most certainly “peaked” in mid 2013.
So let’s have a bit of fun here, and create a “Super Composite” dynamic factor model combining all the Labor indicators discussed above bar the HWOL which has too short a history. So this is the 19-factor dynamic factor model plus the Conference Board ETI plus the U.S Civilian Unemployment rate plus the % of states with growing unemployment:

The above model has a very high 0.998 correlation (Area under the curve, or AUC) with US economic contractions and expansions when using -5 as the contraction/expansion trigger but is just as useful using the zero trigger level, which just happens to provide a 4-6 month lead to recession.
The bottom line is there are no alarm bells for recession according to the labor indicators just yet, but the labor market growth certainly looks to have peaked and is indicating far less strength than is commonly thought. In fact, leading indications are that labor market gains are likely to be muted going into Summer.
Comments are closed.