
The Conference Board Help-Wanted-Online (HWOL) program is closely followed by us to get a feel for the labor market. It is one of over two dozen labor indicators we examine. The monthly HWOL data have been produced by the Conference Board since May 2005, replacing the Help Wanted Advertising Index of print ads, which was published from 1951 to 2008. HWOL data contain the universe count of all ads posted online during a month, with a mid-month survey reference period (e.g., data for October would be the sum of all posted ads from September 14th through October 13th). The HWOL program collects data from over 16,000 online job sources and removes duplicated ads.
The February release incorporated revisions with the following description “With the February 2017 press release, the HWOL program has incorporated its annual revision, which helps ensure the accuracy and consistency of the HWOL time series. This year’s annual revision includes updates to the job board coverage, a revision of the historical data from May 2005 forward, an update of the Metropolitan Statistical area definitions to 2015 Office of Management and Budget (OMB) county-based MSA definitions, and the annual update of the seasonal adjustment factors.”
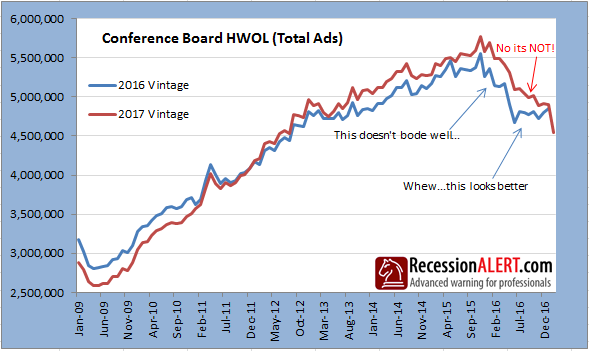
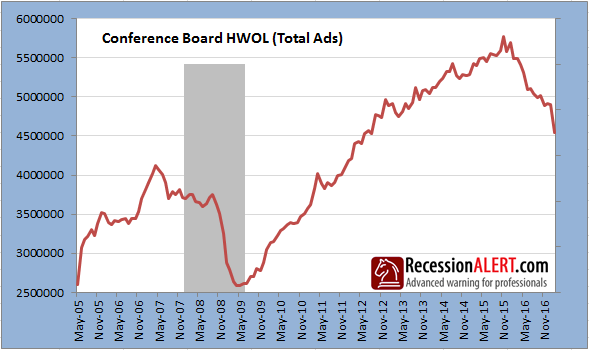
“Great stuff” we thought. “Some solid revisions to keep us honest”. First up was “Total ads” which are all unduplicated ads appearing during the reference period. This includes ads from the previous months that have been reposted as well as new ads. We had to double-take when we looked at the data. It looked vastly different to the last time we peeked at it. Upon inspections the revisions were downright nasty:
We also look at the “New ads” which are all unduplicated ads which did not appear during the previous reference period. An online help wanted ad is counted as “New” only in the month it first appears. This is more volatile but provides useful comparison data to “Total Ads”. Again this is when that coffee you’re holding spills into your lap as you look in disbelief…ugly ugly ugly.
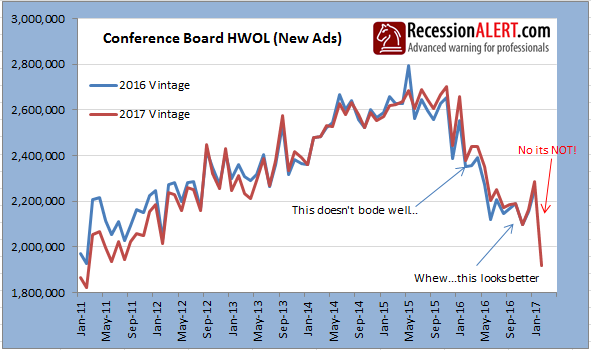
Both of these metrics are screaming recession from the hilltops – and this just after revisions. Given that the Conference Board is an organisation that’s being doing the data compilation and revisions thing for a while now, this has to be pause for thought. The labor market is not as well as we may think.
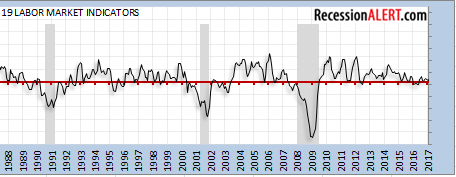
Let’s look at various labor indicators taken from our Long leading Index of US Economy:
Weekly Unemployment Claims, an old stalwart, look benign..
The Fed’s composite of 19 Labor Market Indicators looks rather pale….but no rooftop alarm bells just yet.
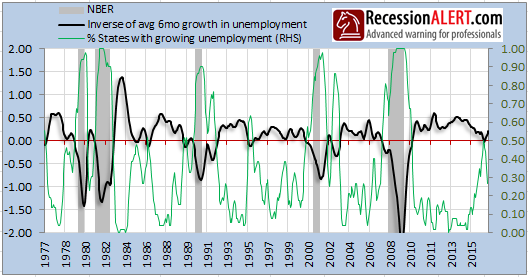
We had quite a scare from the % of US States with rising unemployment rates, but that resolved itself over the last 3 months:
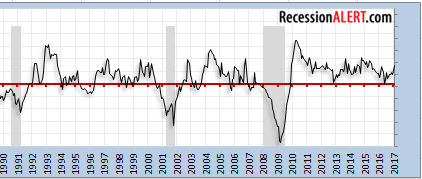
So these HWOL revisions look rather alarming, but are not being collaborated by many other traditional metrics. Lets look at it again, but in the context of the last recession (grey shading). There’s no two ways about it – butt ugly.
The folks at The Conference Board are onto this though. From their website : “NOTE: Recently, the HWOL Data Series has experienced a declining trend in the number of online job ads that may not reflect broader trends in the U.S. labor market. Based on changes in how job postings appear online, The Conference Board is reviewing its HWOL methodology to ensure accuracy and alignment with market trends.”
The Board of Governers sniffed that something was up in June 2016 already, observing a substantial divergence since the end of 2012 between HWOL and the Job Openings and Labor Turnover Survey (JOLTS), administered by the Bureau of Labor Statistics. From their note : “All told, the average price for Craigslist job ads rose substantially, and roughly doubled since the end of 2012 (Figure 2), coinciding with the period when online vacancy posting as measured by HWOL noticeably underperformed the JOLTS vacancy growth.”

Now that the Conference Board is sanity-checking its HWOL methodology, it’s going to be really interesting to see how this pans out. But can this really be simply blamed on Craiglist prices? I’m not so sure. Surely its not that ridiculously simple?
Our house view is that we may have recently narrowly avoided recession, but are not close to it now. The lessons here are that reliance on single economic time-series, no matter how comprehensive they may appear (HWOL is fairly comprehensive in its number of datapoints), can be dangerous. It also highlights how revisions can wildly swing data with certain economic time series (as opposed to financial data such as interest rates, interest rate spreads, bond yields, credit spreads, corporate bond yields and the like.)
Comments are closed.