
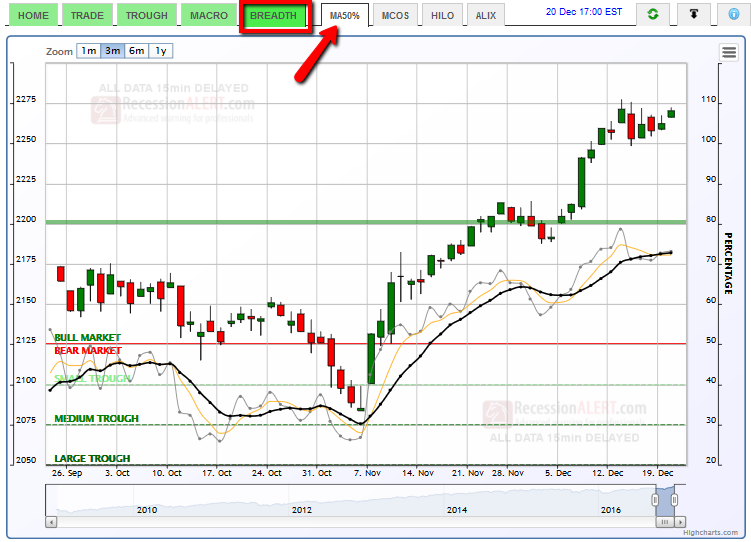
One can examine so many charts during the course of a bull market and only realize upon hindsight how effective some of them can sometimes be. This often happens with the breadth metric derived from the percentage of SP500 shares trading higher than their 50-day moving average. You can find this chart updated daily from the CHARTS>BREADTH>MA50% tab:
Clicking the blue round “i” (info) button on the top right of the chart reveals discussion on various uses of this indicator, but does not pay the “Divergence upon non-confirmation of 80%” phenomenon enough attention. It works like this:
1. A normal healthy bull-leg must be confirmed by prints of the breadth index above 80%
2. If after a print above 80%, the breadth index forms localized peaks below 80%, then you have an impending top warning
3. The top warning is much more severe if (2) occurs against the backdrop of a higher localized high in the SP500.
We have catalogued 15 instances where these 3 conditions occured that led to non-trivial market corrections below :
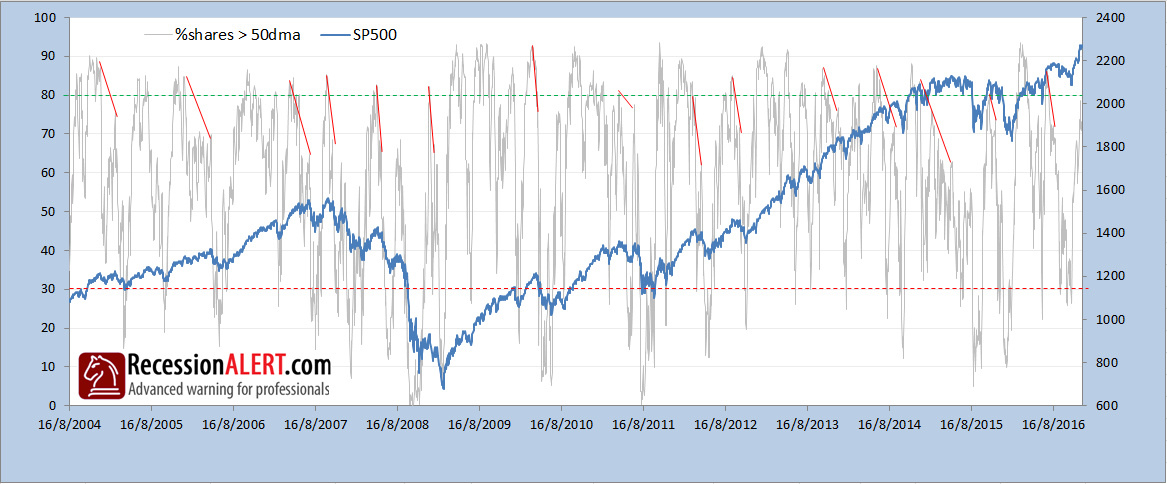
(click image for larger view)
There were about 3 occurences of these conditions (not shown above, but see if you can spot them) that did not lead to a market correction, so as with all indicators, its not perfect. But 15 out of 18 still yields odds that are likely to beat your local casino. Also, the absence of these conditions does not guarantee no correction will occur (but its unlikely). The other quirk is that the impending top warning has no specific timeframe nor guidance on the extent of the correction. The correction can ensue within many weeks with no specific accuracy. So the warning just alerts you to heightened risk and notifies you the current upleg is most likely in the latter stages of its life.
The divergence of this indicator with the SP500 is a manifestation of weakened breadth – ie a stock market that is being propped up by fewer and fewer large-cap shares. This phenomenon -“extreme selectivity” some like to call it – has been linked to stock market tops via many other breadth-guises, namely the Advance-Decline line etc, although very few of them work as consistently well in the short term as this one.
You will note that the current up-leg has still not been confirmed by a print above 80%, although on the 13th December it managed to reach 78%. Until we reach this 80% mark, there are no other reliable ways to use this indicator to warn of impending tops, except when it falls below 50% – but normally some damage has already occured to the index by the time this happens.
Comments are closed.