
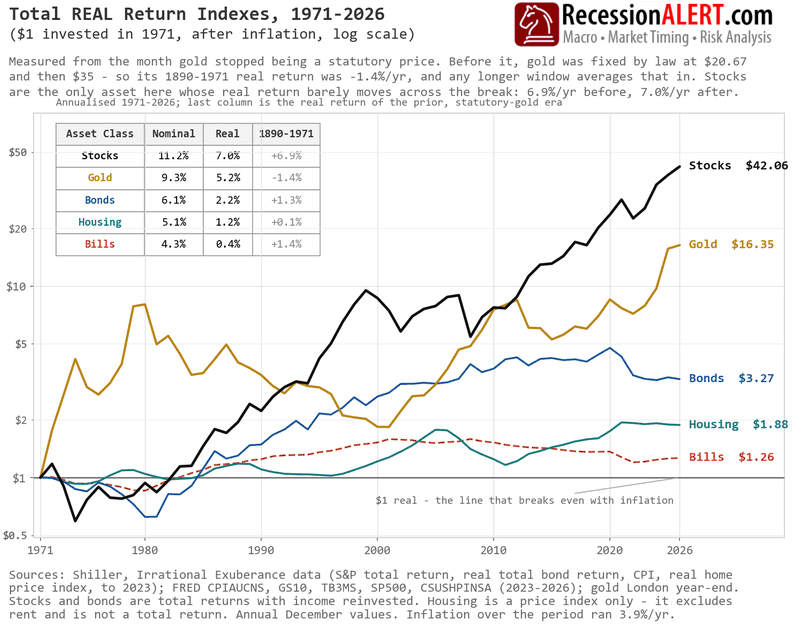
Two numbers on this chart sit eighty-one years apart and differ by eighteen hundredths of a point: stocks compounded 6.85%/yr real under the statutory-gold regime that ended in 1971, and 7.03%/yr across the fifty-five floating-rate years plotted here. Nothing else holds still across that break — gold swings +6.59pp, housing +1.04, bonds +0.85, bills −1.00. Equities are the only asset here whose real return is invariant to the monetary regime, and structurally so: they are claims on nominal cash flows that reprice with the unit of account, so there is no peg to release and nothing for a currency reconstruction to adjust.
Gold is the extreme in the other direction, and its pre-1971 number is not a verdict on the metal. It compounded at minus 1.38%/yr real over 1890-1971 because the price was a declared parity rather than a market outcome — $20.67 from 1834, $35 after the 1934 Gold Reserve Act — held fixed while the price level rose 2.06%/yr. The real return was determined before any buyer appeared. That is why the chart opens in 1971 and plots nothing earlier; the prior era survives only as the inset’s fourth column. It also reframes the vertical gap between the black line and the gold one, which is less a ranking of assets than a measure of how far the previous regime had held one of them below its market price.
Release the peg and the catch-up arrives dressed as a return. Gold’s 5.21%/yr real since 1971 blends a legislated number with a market one, and the path bears no resemblance to the rate: a real peak of $8.02 in 1980, then 88% of the entire 1970s gain surrendered to a $1.84 low in 2000, and no recovery of the 1980 level until 2012. Thirty-two years, with forty-one of the forty-six years after 1980 spent below that peak — a losing position held for essentially an entire investing life, on a line whose annualised number never once wavered. If that record is a one-off repricing off a legally fixed base, the 5.21% is a level adjustment amortised across fifty-five years: long enough to look like a rate of compounding, short enough not to be one.
The current leg carries the same signature. Gold has compounded 29.8%/yr real across 2024-2026, the fastest stretch in the series and nearly triple equities’ 11.5%, and it leads stocks over 2000-2026 as well (8.77% against 6.27%) and over 2020-2026 (11.50% against 10.12%). It has outpaced stocks in twenty-one separate years, crossing above the black line in 1992, 2011 and 2012, and the ratio stands at 2.57 today; “stocks always win” is a claim about endpoints. But a fast repricing is not an income stream, and gold is currently near $4,650, some 16% below its January 2026 record.
The chart’s other real asset moved very little across the same break. Housing compounded 1.16%/yr real to a terminal $1.88, fell 31.0% real between 2006 and 2012, spent eight years below the inflation breakeven, and has not regained its 2021 peak of $1.94. It is a price index, not a total return — imputed rent is excluded, so it understates what an owner-occupier actually earned. Even so, it swung +1.04pp across the break, from +0.12%/yr real before: a real asset, small in level, and still not immune.
Immunity is not the interesting question anyway; incidence is. Regime change is paid for by whoever holds a fixed nominal promise. Bonds have given back 31.3% real since 2020, $4.76 to $3.27, and the mechanism is arithmetic rather than crisis — a constant-maturity index marks to yield, and the 30Y real yield at 2.973% is the highest since October 2001. Repricing 2020’s real yield to today’s is the entire loss. A holder to maturity realised no such thing, but surrendered two decades of compounding at the new rate, a cost that appears on no statement. Bills are quieter and far more widely held: 0.43%/yr real over fifty-five years, below the inflation breakeven in ten of them, bottoming at $0.85 in 1980 — a 15% real loss on money whose nominal value never fell for a single day. With CPI at 3.4%, that erosion is live. Regimes don’t reprice production. They reprice promises.
What it means: if you hold long bonds or a big cash balance for safety, that safety is in the dollar figure, not in what it buys. Stocks have carried purchasing power through a change in the monetary system; fixed dollar promises have not. Watch the 30-year inflation-protected yield: above 3%, sustained, and a bond finally locks in a return that beats inflation.

Comments are closed.