
Below is an animation of the annual average unemployment rate per U.S state from 2011 onward. It’s quite incredible to see how unemployment was erased state-by-state over the years:
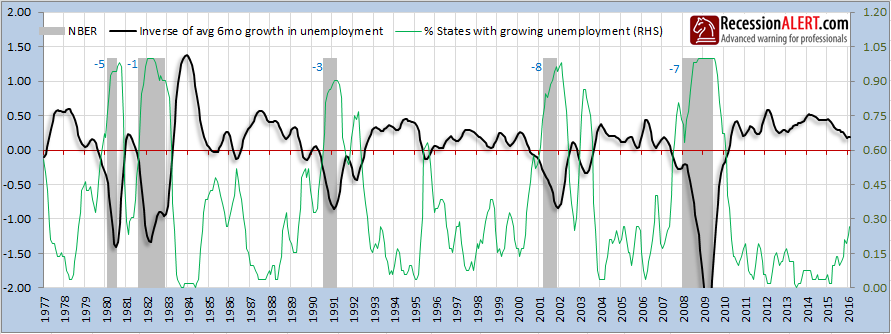
However statewide improvements in employment have probably peaked-out as shown in the chart below, which depicts the aggregate (equal weighted) inverse 6-month unemployment rate growth for each of the 52 U.S States together with a diffusion showing the percentage of 52 U.S states with increasing unemployment. You can see that recently the diffusion has been rapidly rising showing that unemployment is starting to increase again in the 52 U.S states.
Comments are closed.