
The SP-500 Great Trough Project is a technique where we deploy market breadth to determine favorable points in time for investors to “buy on the dips” on the U.S stock markets, more specifically the SP-500. We make reference to a “Great Trough” as rare, large correction reversals on the SP-500, normally spawning a new bull-market leg, or at least a multi-month gain. There have been 40 Great trough signals since 1987 or roughly 1.6 signals per year or one per 7.5 months.
NOTE : THIS CONTENT IS NOT APPROVED FOR REPLICATION ELSEWHERE. YOU CAN LINK TO IT HOWEVER.
These Great Troughs are rare, but their rarity also comes with a major benefit, namely their accuracy. It is our experience that the higher the frequency of signals generated by a system the less accurate it becomes. The purpose of this project is to identify high confidence points in time where subsequent market gains are likely to be highly favorable with very few false signals. Although it is possible to use the Great Trough signals for short term trading purposes, this is not the original intention. The intention is for investors and funds to pinpoint periods in time where the odds are significantly to the upside for further stock market gains over multi-month periods, thereby creating compelling arguments for the placement of funds into the market. This is classic “buy on the dips” strategy as opposed to regular fixed-date placement of funds into the market (dollar cost averaging.)
There is no exit signal. By definition of investing, your exit signal is when the Recession Forecasting Ensemble (RFE) starts rising and you start migrating from equities to cash the higher the RFE rises. Currently there are seven levels to the RFE ranging from zero (no recession in sight), then one (average 6 months to recession) up until 6 (we are already in recession.) Given that optimal stock market timing activities are governed from being 100% in cash 4-5 months from business cycle peaks (see Recession : Just how much warning is useful anyway?) this would imply that when RFE reaches two (avg 4 months lead to recession) or three (average 3 months to recession) a significant portion of your equity should be in cash. So the exit signal is the RFE, and how you decide to stage your exits (or hedging for that matter) is up to you in terms of your risk profile, your specific holdings and your specific objectives.
This does not stop a trader from deploying standard trading exit tools to the great trough entry signals. But understand this is trading and not investing. A simple trading exit strategy that seems to work well is the four week (20 day) lower Donchian line (lowest low of the last 20 days) but there are bound to be more superior alternatives. Given that the Great trough signals are so rare you will need lazy exit strategies that give the trade some reins for volatility since being shaken out a trade prematurely could exclude you from large chunks of multi-month gains whilst you await the next signal. We are not a trading advisory (yet) so we will leave it at that for now.
The Great Trough Project currently uses a single breadth metric to determine large corrections that have reversed course. The breadth metric is a smoothed average of the quarterly new hi/lo index which measures what percentage of NYSE common stocks (omitting preferred stocks, warrants, etc., which have a markedly distorting influence) are making new quarterly highs, divided by those making new quarterly highs plus those making new quarterly lows. Index = smoothed New HI/(New HI + New LOW)*100. The divisor thus makes it a percentage ranging from 0% (extremely oversold) to 100% (extremely overbought). The smoothing constant remains proprietary to us at this stage.
The timing signal identifies those periods in time when the Hi/Lo index is below 27% as extremely oversold. It is at this point that the algorithm awakens from a deep 6-7 month slumber as market participants are in panic selling mode. It takes a lot of sustained heavy selling pressure to get this index below 27% as both the number of stocks making new highs has to be very low and the number of stocks making new lows has to be very high. At this stage we are merely put on alert that a possible buy-on-the-dip opportunity (a Great trough) is in the making. We then wait for a predetermined amount of days (14 trading days) to see if the signal can swing above 87% before we issue the BUY signal. This “slingshot” effect from extremely oversold to extremely overbought in such a short space of time (3 weeks) is excellent at marking time for Great Trough Reversals as shown below:

It becomes immediately obvious that signal frequency since 2002 is a lot higher than before 2002. This is not out of the ordinary in terms of a host of other indicators we research and track for the US markets. Greater stock market participation, hedge funds and prop desks and emergence of high frequency algorithmic-trading coupled with more frequent bubble booms and busts have had a significant impact on stock market volatility since the 2000 bear market. If you stare closely enough at the above chart and look at the “squiggly” behavior of the SP-500 price line you will note that it gets a lot more “squiggly” after 1999. However the principles remain sound, namely there are bouts of extreme selling followed by bouts of extreme buying that flag great trough reversals very successfully. If we look at 2000 onward then we have 12 years and 30 signals or roughly one signal per 4.8 months on average. The first signal after a large enough SP-500 correction (7% or more) is normally the “new bull leg” signal and it can have anything from 3-5 continuation signals before the next big correction.
If one examines the above chart closely we can identify 40 signals in total and visually we can say that about 11 (27.5%) of them were “duds” from the aspect that a correction ensued shortly after the signal. However, visually inspecting again we can say that from a investors perspective that all but 7 (17.5%) led to losses within 3 years. Given that most of these were clustered in the 2007 period when most recession models should have been screaming recession it stands to reason that coupling these signals with the RFE would have historically at least, yielded successful buy points in time.
One other thing we notice from the visual inspection is the lack of these signals during protracted bear markets. We conclude that the first two signals after protracted corrections are excellent signals that a new bull market has commenced. It is important to note that these signals do not identify “ground zero” of the trough. In many cases it comes very close but in most cases the signal is only given after a significant increase in breadth (defined by the 87% of stocks making new quarterly highs) at which point the market may have risen quite significantly already. Again we stress that pinpoint accuracy is not the objective here, but identification of broad favourable points in time where long term gains are likely to be favorable.
The signals and the breadth index since this current bull market started in 2009 are shown below:
")
Great Trough History (click to enlarge)
Making a quantitative (as opposed to visual) assessment of the success of these signals is more tricky. The markets are not that predictable that there is a set number of days after each signal that always yields the best results. However we have determined that 37 days, 80 days, 120 days and 150 days holding periods seem to “bring out the best” in these signals. Again we use these time-frames merely in order to conduct quantitative assessment of the success rates of the signals and by no means are saying that these holding periods are ideal for trading purposes. There are 40 signals, each with their own unique optimal holding period and we are merely aggregating into these 4 groupings to highlight some quantitative statistics for you to get a “feel” for general expectations.
The actuarial tables below describe the nature of the signals’ returns since 1987 and 2009 respectively (when this current bull market started) from a number of perspectives for both 37 day holding periods and 83 day holding periods. The first two columns are the 37 day holding periods since 1987 and 2009 respectively whilst the 2nd two columns are for the 83 day holding periods.

We see that the best short-term results were achieved with 37 trading days as the “holding period” producing 72.5% winning trades with an average gain of 5.16% since 1987. More importantly we like to examine the total points gained divided by the total points lost across all “trades” to get a feel for the gain-to-loss ratio of the signals which at 1.94 is not that impressive from a traders perspective (traders look for 3:1 or more risk/reward ratios). As we stated previously, do not expect any “great shakes” from these signals in the short term. Note that the success rate of the short term holding period since 2009 is much better, suggesting win-rate expectations during the course of a bull market are better than all time including bear markets.
However things start to shine after 80 days (4 months) as shown by the last two columns where the win rates remain unchanged but gain/loss ratios start to climb considerably. It is an eye-opener to consider that the 15 signals delivered since this current bull market commenced in 2009 not only delivered a 86% or more winning rate with average 11% gains, but that the points gained on the winning trades (148.88) outnumbered those lost on the losing trades (7.94) by a staggering 18.74-to-1! Traders would give they eye-teeth for these sort of risk/reward ratios.
For the investors, things get better the longer you hold the signals. The “long-term” tables below showing 119 (6 month) and 150 day holding periods are encouraging. In fact the reason we use 119 and 150 days is that these are periods that “bring out the best” in the Great Trough signals statistical results since 1987. The 150 days holding period gave us the best win-rate and total net points gained (ie made the most money as a trading regime) whilst the shorter 119 days trades delivered the best gain/loss ratios since 1987:

Again, it is constructive to consider that the 15 signals generated since March 2009 delivered in excess of a 93% win rate after 150 days with an absolutely unbelievable gain/loss ratio in excess of 100 to 1. Think about that – for each 1 percentage point we lost we clawed back another 100 or more on the winning trades.
We encourage you to temper expectations suggested by these tables. They are general guidelines taken from averaging a lot of things over long time periods. It is quite possible the very next signal we see is an absolute dud. However it is instructive to have these tables to give us general guidelines for expectations when conducting stock market operations. Your normal risk management and position sizing techniques are as important as ever with these signals regardless if you are trading or investing.
Whenever the Great Trough detector signal crosses the arming trigger of 27% and crosses up through the buy trigger of 87%, RecessionALERT subscribers will be notified by email with an accompanying chart similar to that shown below:

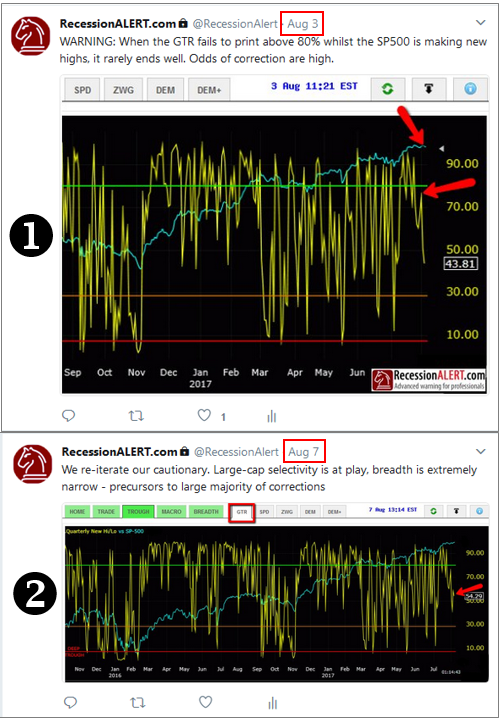
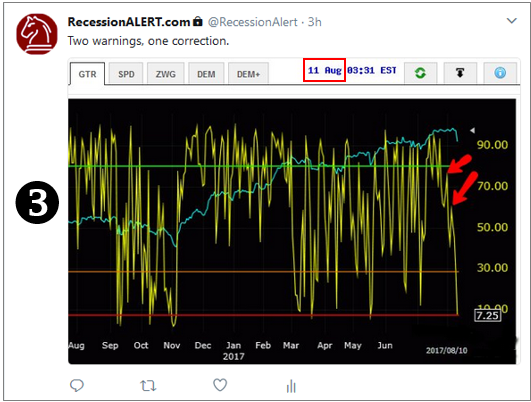
MARKET TOP WARNINGS
The Hi/Lo breadth signal is also uncannily accurate in warning of market tops. A classical interpretation is shown in the alert provided below:
Comments are closed.