There is no question that the Global Economy is languishing. Now, with weakness in US economic data starting to filter through, the big question that arises is if the U.S will be dragged down by the global economy. The U.S is a very insular economy and whilst there can be no doubt that global economic slowdowns do have an effect on the U.S economy, we show that the correlation between global recessions and U.S recessions is surprisingly low.
EXHIBIT-A : Global Recession versus U.S Recession
The chart below shows very little correlation between global recessions demarcated by the OECD for the 40 countries it tracks, and recessions demarcated by the National Bureau of Economic Research (NBER) for the U.S. In fact, since 1962 there have been a lot more Global Recessions than U.S recessions (13 versus 7). Only one thing can be said with certainty and that is that every U.S recession was indeed in the midst of a Global Recession. In other words, the U.S has never been in recession in isolation to Global Recession. Finally, whilst there is non-trivial correlation between the SP-500 and U.S recessions, there seems to be no correlation between the SP500 and periods of Global Recession:
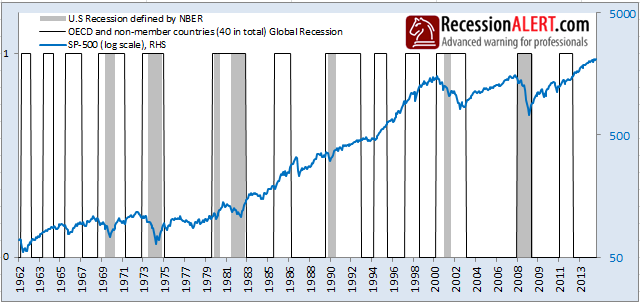
EXHIBIT-B : Global Leading Economic Index versus U.S Recession
The chart below shows the Leading Economic Index of all OECD and non-member countries (amplitude adjusted) or the GLEI for short. The GLEI is somewhat flat at present, representing lacklustre future global growth. Whilst peaks in the GLEI forewarn nicely of global recession, they are far less useful for providing any information on future U.S recessions:
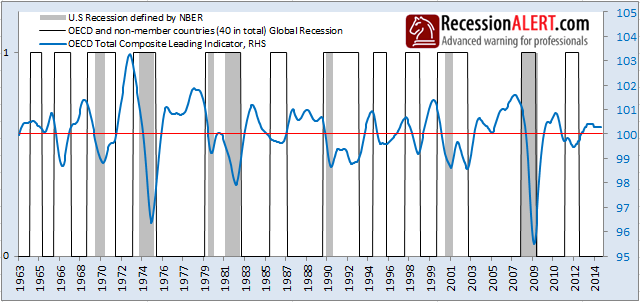
EXHIBIT-C : Global Leading Economic Index diffusion versus U.S Recession
The chart below taken from our regular monthly Global Economic Report, shows percentage of OECD and non-member countries with LEI growths below zero. Whilst this signal provides a useful signal for Global Recession it is less useful at providing anything useful about U.S recessions:
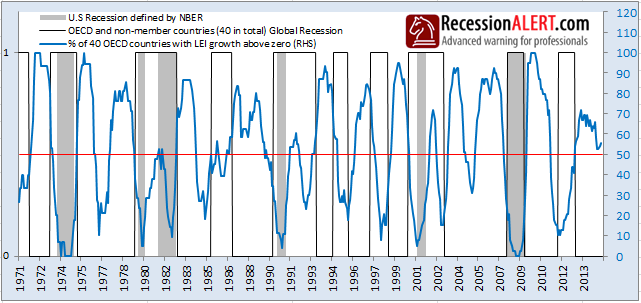
EXHIBIT-D : Global GDP Diffusion versus U.S Recession
The chart below, taken from our regular monthly Global Economic Report, shows the percentage of OECD and non-member countries experiencing a single negative quarterly GDP growth print and 2 consecutive negative quarterly GDP growth prints versus U.S recessions. We have determined that since 1960, percentages of single negative quarterly GDP growth prints above the 40% threshold are somewhat useful at providing information about U.S recession. This mechanism has historically provided for 3 leading, 3 coincident, 2 lagging and 2 false positive signals of U.S recession. The consecutive negative growth prints (red line) are far less useful:
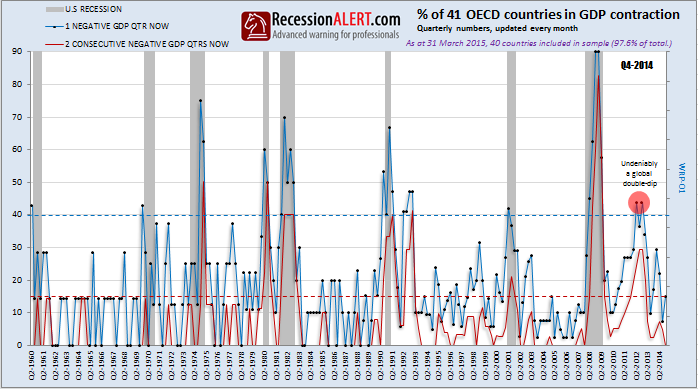
EXHIBIT-E : Global World Trade versus U.S Recession
The chart below, taken from our regular monthly Global Economic Report, tracks World Trade Volume which is defined as the average of imports and exports taken from CPB World Trade Database to give an idea of broad economic activity. Data is updated monthly from international trade statistics as opposed to national accounts data and contains foreign trade value series of 23 OECD countries and 60 emerging economies, giving coverage of total world trade value at around 97%. Whilst we only have accurate data since 1992, we see that for the last two recessions at least, negative growth of this index does indeed provide some useful information for U.S recession. It is interesting to note that as of February 2015, global world trade appears to be in recession:
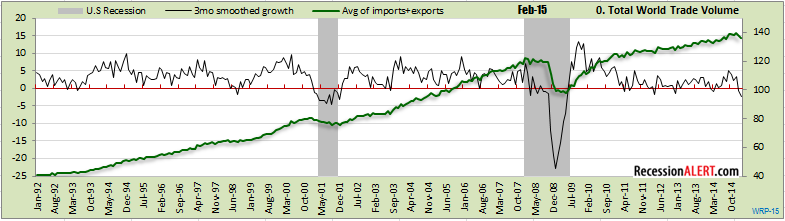
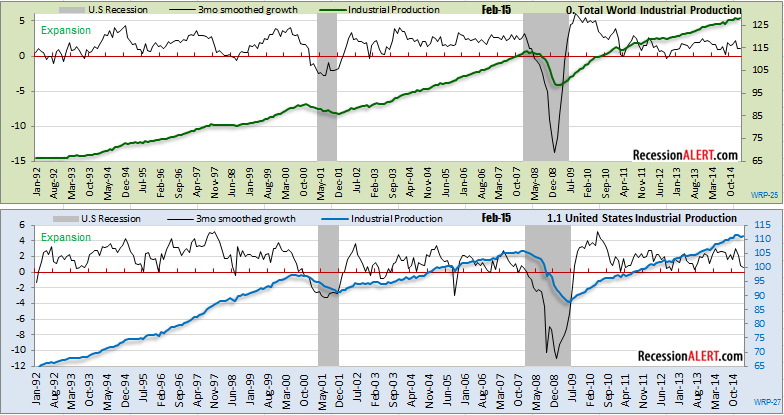
EXHIBIT-F : Global World Industrial Production versus U.S Recession
The chart below, taken from our regular monthly Global Economic Report, tracks World Industrial Production. This uses production-weighted (not GDP-weighted) Industrial Production figures from the World Trade database. Many business cycle co-incident indices are referenced against industrial production in their creation and thus even though industrial production is not representative of all of a region’s ‘ economy, it is highly correlated from a business cycle perspective. From the 2008 Great Recession below, we see that U.S Industrial Production provides far more useful information on U.S recession than total world industrial production
Conclusion
Historically, there is little correlation between Global Recessions and U.S recessions, except in that when the U.S is in contraction, so is the rest of the world. However certain metrics on the global economy do provide some useful input into U.S economic determinations.
You can download a recent March 2022 sample of our Global Economic Report below: