
Since the onset of Covid-19, there has been a lot of research (and release) of alternative (non traditional) high-frequency data to measure the extent of the economic collapse brought on by coronavirus lockdowns, as well as to measure the post-lockdown economic recovery.
Think of Google, Apple and SafeGraph geolocation data to track movement of people around workplaces and residential places, foot and transit traffic data, hotel occupancy, movie ticket sales (BoxOfficeMojo), TSA traveller throughput, seated diners (OpenTable) and so forth.
We have found a nice summary of a subset of such data at https://tracktherecovery.org however we felt that it omitted the aggregation of said data to obtain an overall view of the economy, some data was not timely or relevant enough and we thought the Dallas FED MEI would be a much more comprehensive inclusion to express mobility and engagement as opposed to the simple Google “time away from home” geolocation data.
Additionally we wanted to compare a composite of all this data to our own Weekly Leading Economic Index (WLEI).
The result is the weekly updated Post-Covid Economic Recovery Tracker (WPCERT) which is now available from the Projects Workbench page:
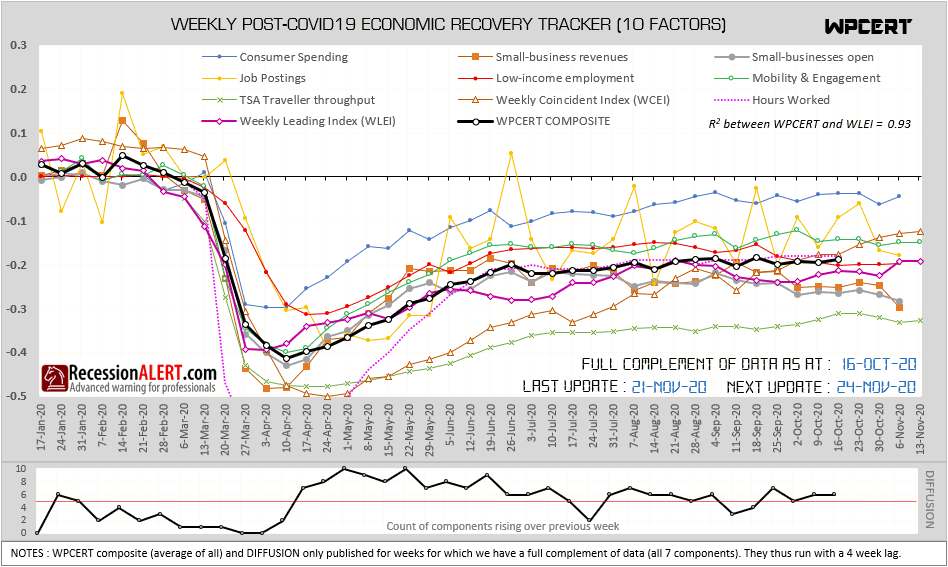
It is clear from the above that the US economy (as expressed by all these indicators aggregated together) recovered strongly until 26 June and has been declining ever since. This leaves in to question the ability for a V-shaped recovery.
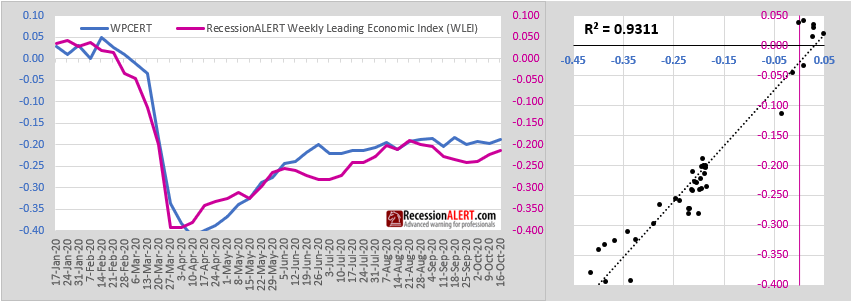
We also find that the WPCERT and WLEI are also highly correlated:
The current list of components we use are shown below:
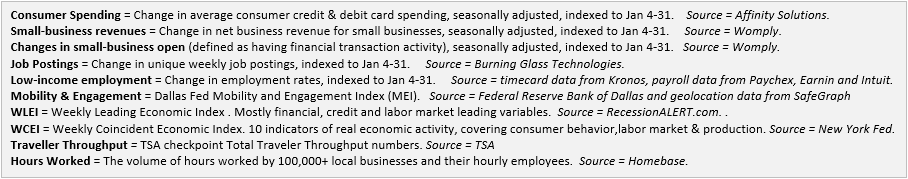
You will notice where possible, a leaning toward data from small business and low income segments, since these have been shown to be much more sensitive to changes in the economy than larger businesses or higher income earners.
Also wherever possible, we will favor seasonally-adjusted data, since much of this new high frequency data (such as mobility for example) is not seasonalized. Since we are looking at short periods of time with less than a year history, seasonal effects (such as holidays etc) can have out-sized impacts on the data, leading to potentially incorrect conclusions.
Comments are closed.