
The RecessionALERT USMLEI (US Monthly Leading Economic Index) is a 21-factor monthly leading index for the US economy. It is described in detail in this research note.
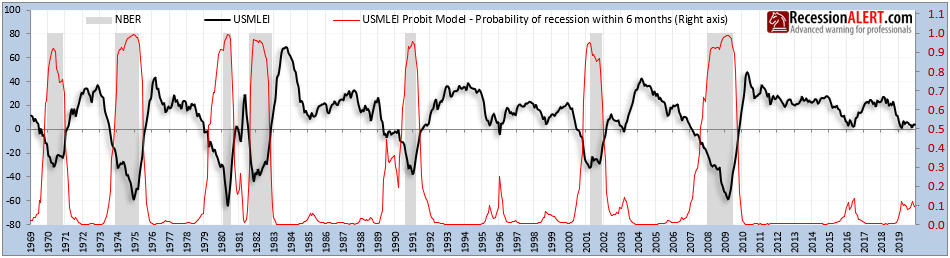
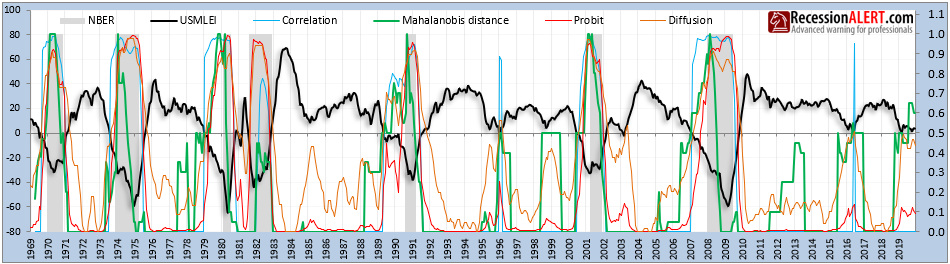
Up until now, we had deployed a standard Probit statistical model to track implied recession probabilities of the USMLEI. Whilst the Probit models still provide a reasonable lead-time of recession warning, it faced the problem of only assessing the current level of the USMLEI and how often in the past this level was accompanied by recession, when determining recession probabilities. It did not examine any contextual information such as the slope of the USMLEI, the duration of the decline, the size of the current decline nor any USMLEI internals. As such, it was a very conservative model with the added bonus of very few false positives (probabilities are always on right-axis):
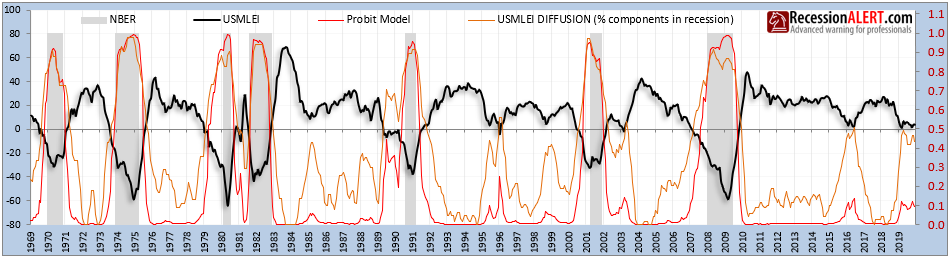
With regards to USMLEI internals, we found it very useful to examine the Diffusion Index, more specifically the percentage of 21 USMLEI components that were themselves in recession territory. These implied probabilities were less optimistic than the Probit model and thus gave earlier warnings with only introducing a single historical false positive (1996):
In the first week in February 2020, William B. Kinlaw (State Street Global Markets), Mark Kritzman (Massachusetts Institute of Technology (MIT) – Sloan School of Management) and David Turkington (State Street Associates) released a research paper titled “A New Index of the Business Cycle“. They used a scientific approach initially developed to measure human skulls (Mahalanobis distance) to determine how the relationship of three economic and one financial factor compared to prior recessions. After reviewing their paper, we considered their approach novel and useful enough for us to model the same for our most comprehensive leading indicator, namely the USMLEI.
The approach is essentially a regime-based one, requiring us to model a typical “recessionary regime” depicted by the USMLEI. To this end we arrived at the following Recession Approach Regime based on historical data of the USMLEI:
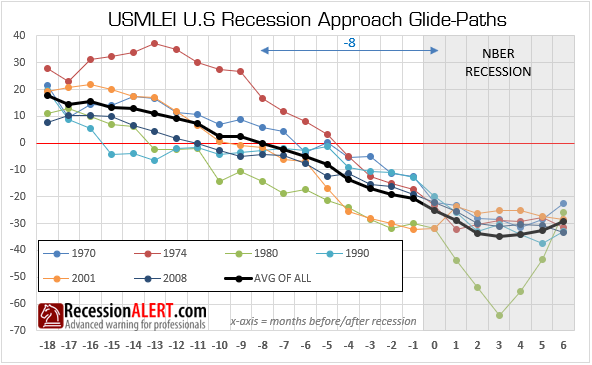
We define a recession approach regime as the 18 months prior to NBER recession and the 6 months after the start of the recession. Note that we ignored the double-dip recession of 1982 in this regime since it did not have a clear 18-month approach path that never touched any prior recessions.
With average historical recessionary regime in hand, we found one additional useful model in addition to the Mahalanobis distance, namely the Approach Path Correlation Model that, each month, would examine the past 18-months of the USMLEI and determine the r-square correlation coefficient to the average approach glide-path. This was an effort to determine how closely the last 18 months readings matched the average slide into recession. It is shown in light blue below:
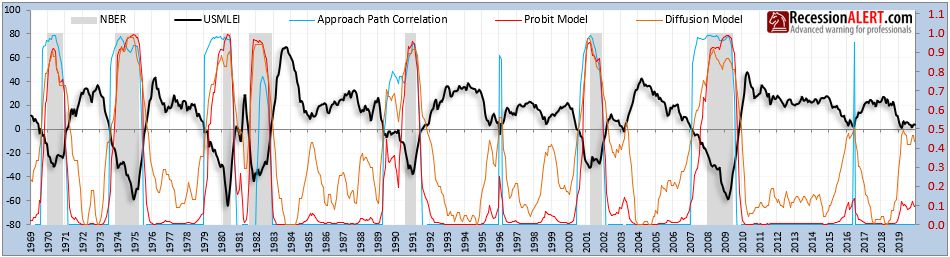
Despite earlier warnings, this model does have two brief false positives in 1996 (similar to the Diffusion model) and mid 2016. But it does a pretty good job in capturing sharp and persistent downturns in the USMLEI (slope and duration) and represent these as a risk via a probability reading.
Finally onto our interpretation of the Mahalanobis distance (we have many important as well as subtle differences and simplifications to the approach in the MIT paper), which better captures matches of rolling 18 months to the typical recessionary approach glide-path, since it examines each month to its typical historically averaged counterpart, and specifically makes a point of matching positive numbers to positive numbers and negative numbers to negative numbers (something a correlation model cannot do) to capture the slide of the USMLEI into recessionary territory:
This model also provides early warnings similar to the other regime model (correlation) but with no historic false positives, excluding of course the latest readings which can only be confirmed as legitimate once the NBER declare the next recession. Interestingly it provided a recent peak probability of 65% of a recession within the next 12 months, not far from the 70% painted in the MIT research paper.
However we would not deploy this method on its own, and rather incorporate all 4 methods in order to lower our aggregate model risk. As such it is more instructive for us to assess the average probability of all 4 models or indeed the average of the top-2 probabilities at any time, as depicted below:
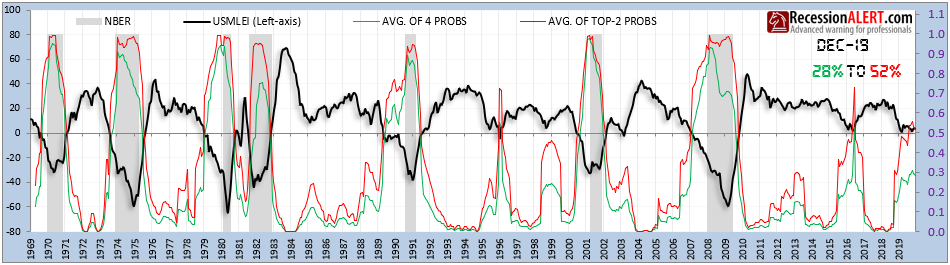
With this overall average probability we are capturing level, internals, slope, size, duration and sign-matches of potential recession approaches with very few false positives.
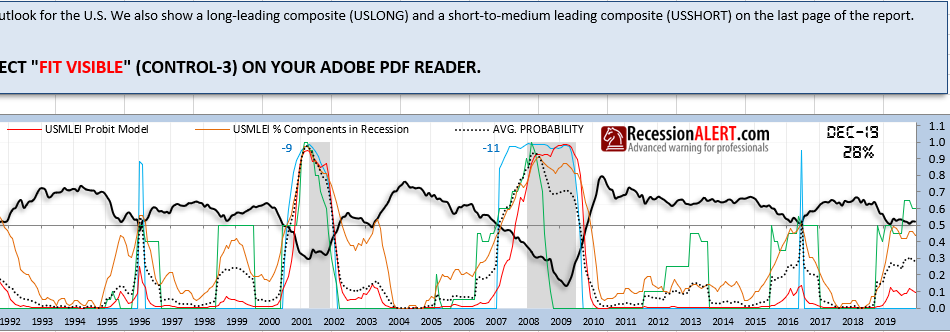
All four probability models and their average will from now on appear right at the top of the monthly USMLEI PDF report we publish for our subscribers, as depicted below
31 JULY 2020 UPDATE :
Below are the readings of all the probabilities mentioned above, as of 30 June 2020 – some 5 months after this research note was published.
The Mahalanobis distance probability model was the only one that provided a warning of the Covid19 Recession. The August 2019 print (visible end of Sept 2019) jumped above 50% to 65% some 6 months before the US economy fell into recession (using the March 2020 official start date provided by the NBER) :
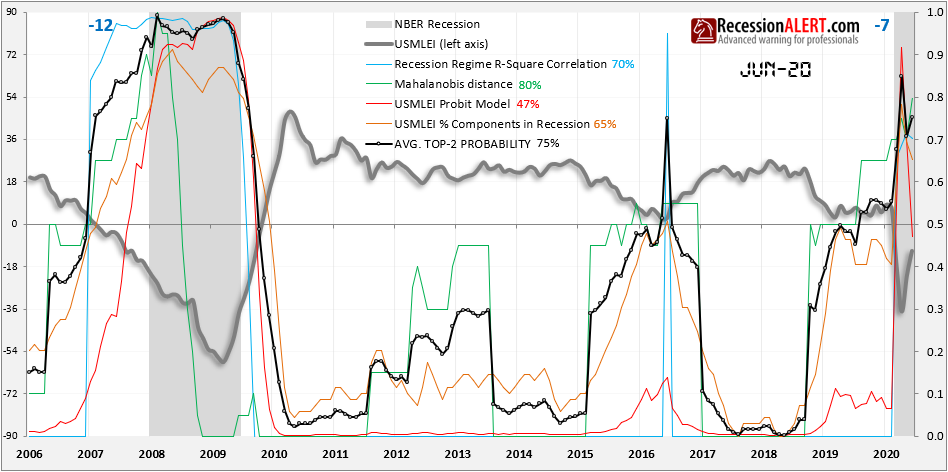
We prefer to use the Average of the Top-2 highest probabilities to ensure earliest warning (or best pessimistic probability), since some probability models may offer earlier warning than others across different recessions. For example in the 2008 recession, the Recession Regime R-square correlation model provided the highest probabilities, whilst in the 2020 recession it was the Mahalanobis distance model. Using this would provide some 12 months warning to the 2008 recession and 6 months warning for the 2020 recession.
Comments are closed.