
1.Introduction
In the three days following President Donald Trump’s announcement of sweeping tariffs on April 2, 2025, dubbed “Liberation Day,” the U.S. stock market experienced a dramatic downturn, often referred to as the “Trump Tariff Tantrum.” (TTT) The Dow Jones Industrial Average plummeted over 2,200 points, with the S&P 500 dropping nearly 5% and the Nasdaq falling close to 6% by April 4, erasing post-election gains and wiping out an estimated $5-6.4 trillion in market value. The tariffs, including a minimum 10% on all imports and up to 50% on goods from 57 nations, sparked fears of a global trade war, prompting retaliatory measures like China’s 34% tariffs on U.S. goods, driving recession concerns, and shifting investor expectations toward rapid Federal Reserve rate cuts. Despite some market recovery attempts by April 7, Trump’s refusal to back down and threats of further levies on China kept volatility high and confidence low.
2.Dissecting the TTT
The largest one-day move we saw in the markets’ Trump Tariff Tantrum (TTT) was -5.97%. Daily SP-500 moves since 1960 have a mean of zero, standard deviation 1, so this represents a SIX SIGMA event – something that occurs 3.4 times out of a million. There have been 18 prior occurrences (> 5.95% daily move to the downside) since 1960 but the chart below suggests they are often clustered together.
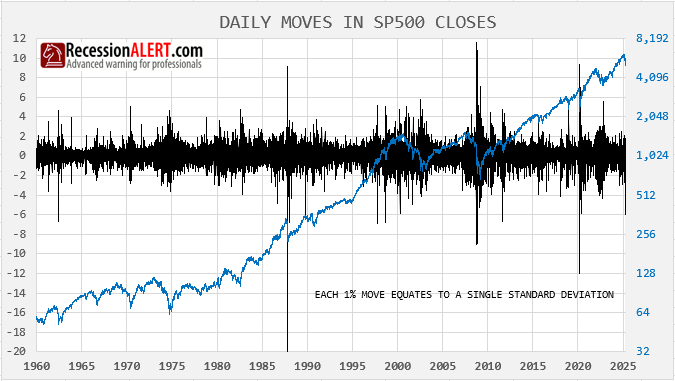
In fact only 6 times in the past has the first such occurrence been the only isolated one. So entering the market now only offers you a 6/18=33% historical odds we wont see another occurrence again in the next few days. This means you will need some decent follow-through signals to enter the market to avoid potential further extreme down days.
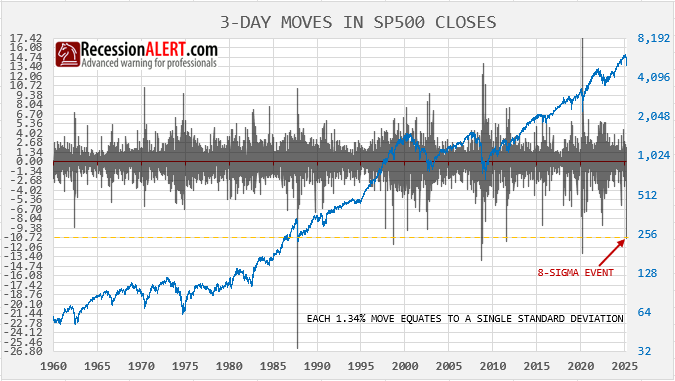
The TTT has witnessed a 3-day draw-down of 10.73% since tariffs were announced. This is the total extent of its damage so far. The TTT draw-down was an 8-sigma event. There have only been 10 cases of a 3-day draw-down exceeding 10.72% since 1960 and only in 3 cases was the first occurrence isolated. This leaves you with a 3/10=33% historical odds we wont see a 3-day draw-down of this nature again within the next 10 days (admittedly with small sample size).
The lesson from these two examples is clear – initial extreme downside volatility begets more extreme volatility in 2/3rds of cases. Extremes in downside are thus poor buy-the-dip signals and decent follow-through signals are required to properly approximate decent entry points.
One of the peculiar features of the TTT is that panic levels were much less than one would expect of a drawdown so ferocious in its nature. On the 2nd day of the TTT we noted that a significant back-to-back plunge like this – without an absence of 13 or 52-week highs – suggested we were not near the bottom as EVERY significant (and some not so significant) bottom since 1990 was characterized by a total lack of new highs:
This implied there had not been widespread indiscriminate (panic) selling – a hallmark of all significant bottoms. On the first big down-day of the TTT, new highs actually rose! On the 2nd six-sigma down day, new highs were still present! We assumed that there was heavy selling of large caps, but also rotation into something else:
Were it not for the Tariff market surprise, we are convinced that 12/13 March would have formed the significant bottom as depicted by the presence of a lack of new highs at that time. Finally, on the 3rd day of the TTT we saw the lack of new highs characteristic of close proximity to major market bottoms.
Geek Note : Eagle-eyed subscribers will realize that one of our most popular buy-the-dip models called “LACK”, (see LACK tab in PRO>CHARTS) is based off this lack of new highs theory when seeking actionable high confidence market entries at non-trivial market bottoms. It performs so well that it qualifies as one of the seven “bullets” in our MEGA model discussed in Section-4 below.
3.How do we measure the size of the opportunity?
Our research has highlighted six common “fingerprints” witnessed at major market bottoms. These are updated in the DASHBOARD>PANIC tab on a daily basis:
These six metrics are rare events only witnessed near major market bottoms and are a mix of drawdown, technical and breadth metric extremes and volatility measurements. The chart shows a count of the presence of these metrics. This is currently sitting at two. This PANIC indicator merely informs us that a major but rare market event is underway. The count is an expression of panic or peak selling pressure through the measurement of 6 things or “fingerprints” that are commonly present AT OR NEAR major stock market bottoms. They will be very blunt buy signals, since panic could lead to more panic. So whilst 2 levels of panic appears rare it has not been uncommon for this to reach six especially in proper bear markets.
So this is not advisable as a buy signal. Yes, if you are prepared to have massive volatility for a few weeks to even months after you enter and willing to wait out 1 year or more then likely they will appear good signals. Therefore it is best to use ACTION or FOLLOW THROUGH signals to get your market timing much closer to ground zero on these corrections rather than the broad zones depicted by the Panic diffusion (count.)
INCREDIBLE OFFER : Get a huge discount off our annual PRO Subscription, with macro- and market timing models plus unique in-depth quant research such as this research note. NOTE: order before end of month and get two years completely FREE. Get your discount HERE
4.How do we depict follow-through?
The tab to the right of the PANIC tab, called MEGA, contains a collection of 7 of our highest confidence follow-through signals for major market events with a PANIC count of 1 or more. At the top pane of this chart we just re-display the PANIC counts again. They are a depiction of the size of the potential opportunity.
The seven models below the top pane present actionable buy-signals with appropriate follow-through characteristics to minimise volatility, drawdowns and post-signal new lows. We use seven models to diversify the signals as each model measures a different non-overlapping set of metrics and market conditions to make its determinations. The techniques and algorithms used by the models also differ widely. The collection also ensures we never miss an opportunity as its rare to find high confidence models that capture all opportunities.
You can observe that there are quite enough signals to keep even the most sedentary market participant busy. Also note that the models may differ by frequency and whilst rare, it is not uncommon to witness major buying signals within bull markets themselves when no panic signals are present.
You will notice than around major corrections with panic counts of 2 or more, many of these signals will “cluster” around the market trough. In fact historically, at least three (3) models have issued signals closely together around major bear markets. To limit risk (its always there) you could elect (as an example) to deploy 33% of free reserves into the market each time you see a signal, to stage your entries.
5. Can we determine exact bottom probabilities?
PRO subscribers can go review the SP500 GEN2 Probability model for exact statistical probabilities of a market bottom based on 25 years of history. In this instance its best to review the medium-term probabilities for such a large correction, and this is depicted below:
It is showing an average probability of 80% which is derived from the drawdown probability of 90% and the duration probability of 71%. As this correction has been so fast because of the TTT 3-day six sigma plunge, the probability derived from comparing the current drawdown to that of the past is obviously much higher than the probability calculated from how long the correction has been compared to those of the past.
These probabilities merely offer you an indication of your likely success and how close we are to a bottom. With the medium and long-term probabilities our approach is to always consult the highest probability rather than the average when assessing trend reversal odds. So in this case we think were more on the 90% probability.
As with the PANIC diffusion these probabilities are merely guides for descision making and not action signals in themselves. They are blunt instruments and you must always rely on robust follow-through signals to provide the lowest risk actionable market entries.
6.Summary
6.1 The PANIC tab measures size and rarity of the opportunity – un-holster the pistol.
6.2 The GEN2 probability model measures proximity and your likely success – remove the safety catch.
6.3 The MEGA tab contains a chamber of 7 bullets for action – pull the trigger.
Pull the trigger multiple times in case your target (trough ground zero) moves!
INCREDIBLE OFFER : Get a huge discount off our annual PRO Subscription, with macro- and market timing models plus unique in-depth quant research such as this research note. NOTE: order before end of month and get two years completely FREE. Get your discount HERE
Comments are closed.