
Since the onset of Covid-19, there has been a lot of research (and release) of alternative (non traditional) high-frequency data to measure the extent of the economic collapse brought on by coronavirus lockdowns, as well as to measure the post-lockdown economic recovery.
Think of Google (NASDAQ:GOOG) (NASDAQ:GOOGL), Apple (NASDAQ:AAPL) and SafeGraph geolocation data to track movement of people around workplaces and residential places, foot and transit traffic data, hotel occupancy, movie ticket sales (BoxOfficeMojo), TSA traveler throughput, seated diners (OpenTable) and so forth.
We have assembled a collection of such data into a Weekly Post-Covid Economic Recovery Tracker (WPCERT) consisting of the following:
- Consumer Spending = Change in average consumer credit & debit card spending, seasonally adjusted, indexed to Jan 4-31. Source = Affinity Solutions.
- Small-business revenues = Change in net business revenue for small businesses, seasonally adjusted, indexed to Jan 4-31. Source = Womply.
- Changes in small-business open (defined as having financial transaction activity), seasonally adjusted, indexed to Jan 4-31. Source = Womply.
- Job Postings = Change in unique weekly job postings, indexed to Jan 4-31. Source = Burning Glass Technologies.
- Low-income employment = Change in employment rates, indexed to Jan 4-31. Source = timecard data from Kronos, payroll data from Paychex, Earnin and Intuit.
- Mobility & Engagement = Dallas Fed Mobility and Engagement Index (NYSE:MEI). Source = Federal Reserve Bank of Dallas and geolocation data from SafeGraph
- WLEI = Weekly Leading Economic Index . Mostly financial, credit and labor market leading variables. Source = RecessionALERT.com.
- WCEI = Weekly Coincident Economic Index. 10 indicators of real economic activity, covering consumer behavior, labor market & production. Source = New York Fed.
- Traveler Throughput = TSA checkpoint Total Traveler Throughput numbers. Source = TSA
- Hours Worked = The volume of hours worked by 100,000+ local businesses and their hourly employees. Source = Homebase.
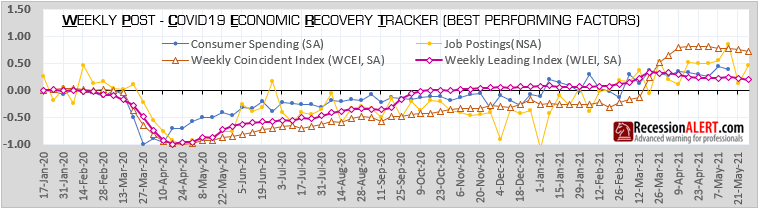
The resulting 10-factor composite is updated weekly and shown below:
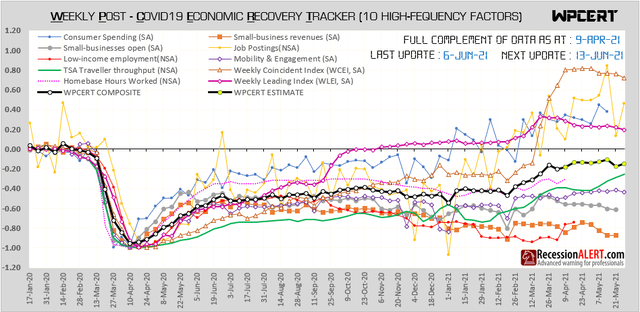
We can make the following observations:
1. The composite index has completed around 80% of a recovery but progress has been agonizingly slow: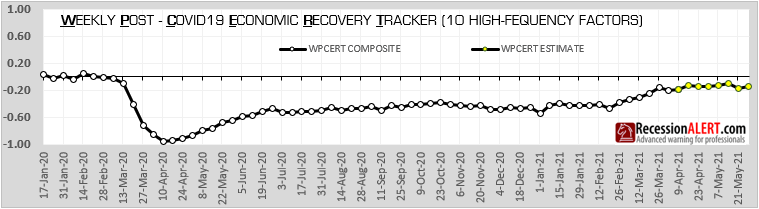
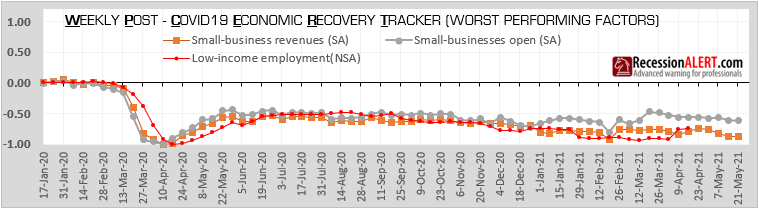
2. Small business and low-income categories have failed to adequately recover. Given the many millions of businesses and employees this covers, this is a tragedy:
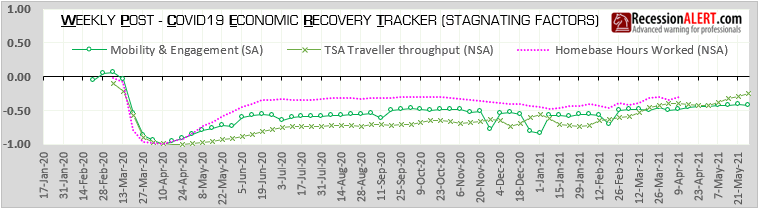
3. Economic mobility, TSA traveler throughput and hours worked all managed to recover half their losses but have failed to make any meaningful improvement on top of that. It is possible that this is the result of a new remote working or work from home paradigm at play here and that these items may not reach pre-Covid highs any time soon.
4. Traditional broad-based weekly economic indicators such as the RecessionALERT Weekly Leading Economic Index (WLEI) and the New York Fed Weekly Coincident Economic Index have shown robust rebounds to new post-Covid highs. Job postings and consumer spending have also shown robust recoveries:
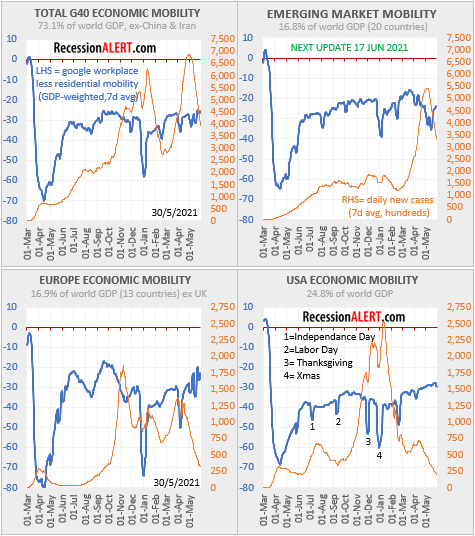
It goes without saying that a large portion of the US recovery is impacted by the success of coronavirus vaccination programs. On this score, the US seems to be faring a lot better than most developed economies with economic mobility improving whilst daily new infections are plummeting:
Despite the encouraging (albeit 3-speed) economic recovery, the broad stock market has likely discounted this all in already and remains stretched with major market top probabilities recently having reached levels normally associated with the start of a meaningful correction:

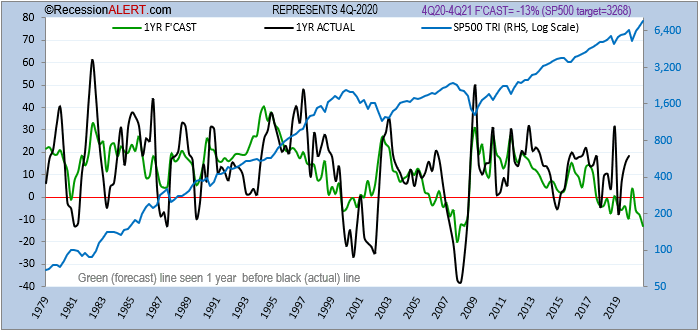
Fundamental valuations according to our RecessionALERT Valuation Index (RAVI) also remain stretched with the 1-year forecasting model (r-square of 0.45 with actual annual future returns) showing negative outcomes that at today’s price levels imply a potential 22% correction:
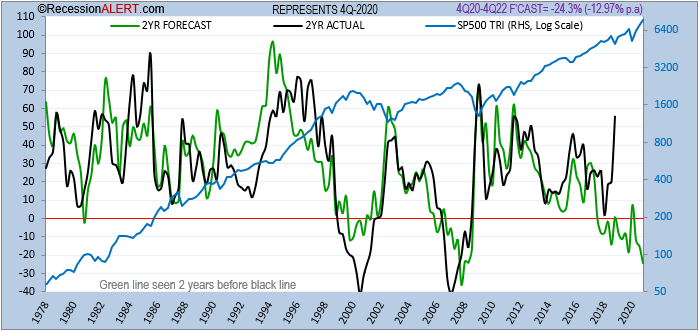
The more accurate 2-year forecasting model (r-square of 0.56 with actual 24 month future returns) also shows negative outcomes that at today’s price levels also imply a potential 22% correction ahead:
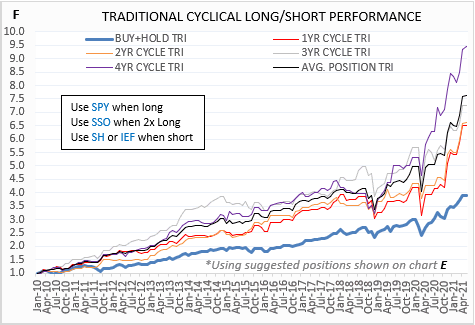
It is also worthwhile noting that the quadrennial market cycle from our STM Seasonality Model, which has been performing exceptionally well with out-of-sample dataset for the last decade is signaling a short position for the month of June:
Finally, the last shocking 4.2% CPI print for the US has led to real earnings yields plunging below 0.35% which has normally presaged a major macro level market top:
With technical metrics (probabilities of a market top), and valuations/real yields both stretched and seasonality at levels normally associated with muted forward returns, it may be prudent to investigate some measures of portfolio protection for the months ahead.
Comments are closed.