
We are pleased to announce the revamp of our historical time-series data file, which is published quarterly, with the following new additions:
- Addition of Labor Market Index historical data
- Addition of Long Leading Index historical data
- Addition of RAVI historical data for 1/2/3/5/10 year forecasts
- New analytic tool & charting visualisations
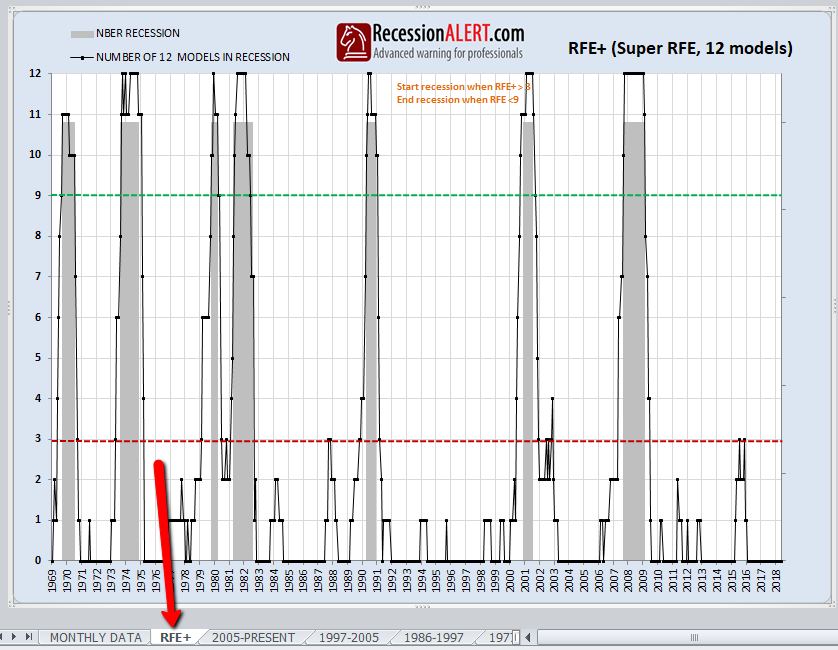
- RFE+ which is index showing number of 12 models flagging recession
The first two items are self-explanatory and you can read about them and look at their sample reports on the OUR SERVICE menu. The third item is the exciting one for our clients since they can view all 7 major recession models we maintain in a side-by-side fashion during each expansion and recession. This allows detailed inspection of the co-movement of our various short-leading, long-leading and co-incident recession models. In addition, clients can select their favorite RecessionALERT quantitative models and combine them together into a custom composite and view the behavior of the composite and its components over time. This allows financial advisers and brokerage firms to custom-build robust recession models unique to their practice or brand for input into the overall quantitative process used by them to manage their clients affairs.
The data file is available for download from the downloads section in the MEMBERS menu:

After opening the file, you can select your favorite RecessionALERT models for display in the new historical charts. The example below shows an adviser having selected the two powerful long-leading models we maintain, namely the USLLGI and the Headwinds Index together into a composite (“Avg. of selection”), as he/she wants to discuss long-leading equity allocation strategy with his client that afternoon:

All that remains is to select from 5 available date ranges covering all recessions & expansions since 1968, by clicking on the respective tabs :

Clicking on the “1968-1977” tab, we can observe the behavior of both our selected long-leading growth indices together with their averaged composite, around the 1970 and 1974 recessions. You can see that both the HeadWinds Index and the USLLGI dipped below the zero line, signalling recession within 1 month of each other some 6 months before the onset of the 1974 recession.

Here is another example, where we wanted to observe the co-movement of the SuperIndex with the US Long Leading Index in the 1997 to 2005 period. We see that the USLLGI signaled recession some 5 months before the SuperIndex, which in turn signaled recession 5 months in advance.

The RFE+ counts how many of our models are showing a recession:
Comments are closed.