
This research note investigates the relationship between the yield curve (US 10-year less US 1-year constant-maturity treasury spread) and the Federal Funds Rate (monetary policy) on the future readings of the CBOE VIX index.
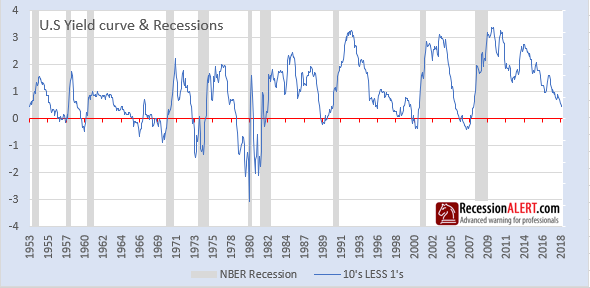
The 10’s vs. 1’s yield-curve and U.S recessions in the post-war era are displayed below, where it is clear that the nine recessions since 1956 were predicted by yield-curve inversion, with one false positive in 1966. The smallest lead-times to recession average 8 months, the median lead-time is 12 months and the longest lead-times average 20 months:
The Chicago Board Options Exchange (CBOE) Volatility Index, or VIX, is a real-time market index that represents the market’s expectation of 30-day forward-looking volatility. Derived from the price inputs of the S&P 500 index options, it provides a measure of market risk and investors’ sentiments.
The CBOE VIX and the Yield Curve relationship are displayed below:

The optimum correlation between the two is obtained when the Yield Curve is shifted forward in time by 136 weeks. This implies the yield curve leads the VIX by around 31-32 months:

The correlation between the VIX and the Yield curve inverted and shifted forward by 136 weeks is shown below. The r-squared of 0.3944 is not insignificant, but more interestingly we can observe that volatility ramps up significantly just pre and post both of the yield curve inversions we have on record for the analysis:


The CBOE VIX index data points are far less smooth than the yield curve data points. This begs the question as to what is the best correlation that can be achieved by smoothing the VIX as close as possible to the yield curve. The answer is obtained at 48 weeks averaging:

Below is the corresponding correlation scatter graph, showing just how significant the relationship is:

We can achieve much higher correlations by looking at longer-term trends and smoothing both the CBOE VIX and the yield curve so that we can find an optimum and a maximum correlation. The optimal correlation is the smallest amount of smoothing to achieve the highest correlation (so we minimize smoothing that removes movement detail) whereas the latter is simply the highest correlation we can find.

Here is the correlation scatter graph and smoothed time series for the optimal correlation:


Here is the correlation scatter graph and smoothed time series for the highest correlation:


The yield curve also correlates well in the above fashion with other measures of stress, such as Kansas City Financial Stress Index, The Chicago Fed’s National Financial Conditions Index, Deutsche Bank’s own gauge of realized Forex volatility, the MOVE index, which measures bond-market volatility and other measures of financial conditions like the Corporate BAA-U.S. Treasury 10-year credit spread.
Federal Funds Rate
The reasoning for these relationships is that as the business cycle starts peaking, the yield curve flattens, mainly as a result of tightening monetary policy which leads to the end of a business cycle. This leads to a spike in volatility as the stock market cycle also comes to an end. The chart below confirms this.
Although the correlation between the Fed Funds rate and VIX is much lower than the yield curve and VIX, the inflection points of changes to monetary policy can clearly be seen to be altering implied volatility trajectories:

The FED funds rate has been trending downwards over the last few decades. We can achieve even higher correlations if we de-trend the time-shifted FED Funds rate around its linear regression:

Whilst this correlation of 0.46 is lower than the 0.66 achieved between the 48-week average of VIX and the Yield Curve shifted by 132 weeks, we are still of the opinion that the FED rates and hence monetary policy are the root-cause of resulting yield curve slopes and future volatility.
Regardless if we look at the yield curve or monetary policy, the implied future direction of volatility is much higher than we are seeing now.
Comments are closed.