
1.INTRODUCTION
Since stock markets began, investors have sought to identify the exact moment a bear market ends and a new multi-year bull market begins. If investors could determine this with high certainty—avoiding both false positives (premature signals) and false negatives (missed signals)—they could deploy capital at the bull market’s earliest stages and maximize returns. This timing matters because up to 50% of a bull market’s gains occur in the initial rebound phase.
At RecessionALERT, we’ve provided timely buy-the-dip signals to private investors and institutions for over a decade. Because new bull markets emerge only once every few years, it’s easy to forget that many of our models excel at identifying major stock market bottoms with high confidence. We’ve combined eight of our most accurate models into a single chart that subscribers can monitor during major corrections to identify optimal low-risk entry points for new bull markets. You’ll find this chart in the MEGA tab under the DASHBOARD menu.
We combine eight models into one chart because no single model is perfect. Each model, despite its high accuracy, has produced either false positives, false negatives, or both in its historical signals. Reducing false negatives typically increases false positives, and vice versa. Additionally, no bear market bottom is the same and thus models with different philosophies and architectures are required to capture all possible eventualities. Each of the 8 models in the MEGA group have their own set of actionable trough signals they bring to the table.
Since new bull market signals occur only once every few years, relying on a single model that might miss a signal could be costly—you could lose out on the early stages of an entire bull market. Conversely, using a single model with occasional false positives could lead you into an expensive dead-cat bounce during the highly volatile bottoming process.
As with many of our past models, we’ve found that combining several high-confidence models—each approaching the problem differently and having minimal false positives or negatives—produces superior results. The combined signal becomes greater than the sum of its parts.
In this research note, we’ll discuss each model and its historical performance, including its timeliness (how close it signals to the actual bottom), false positive tendency, and false negative tendency. We’ll then explain how to use the combined model for near-perfect results.
2. ALGO 1&2
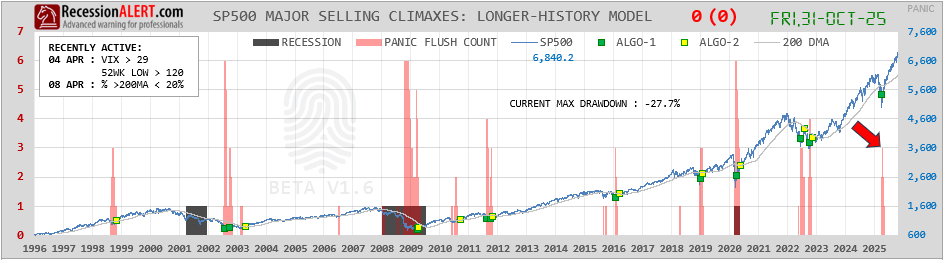
These two algorithms originate from our PANIC measurement model, which tracks six metrics to gauge market panic levels. The model counts how many indicators are showing selling climaxes associated with major stock market bottoms. Six indicators have proven reliable since 1996 across the last four major bear markets and recessions. Each indicator contributes 1 to the Panic Flush Count when its threshold is exceeded:
- Detrended VIX > 29
- Drawdown > 28%
- Percentage of stocks above 200-day MA < 20% for at least 2 consecutive days
- EMA(5) of percentage of stocks above 50-day MA < 10% for at least 2 consecutive days
- Fifteen consecutive days with new 13-week highs < 12 and
- 52-week lows > 119
Contrary to popular belief, peak panic in major bear markets often occurs BEFORE the final bottom. Many assume that major stock market bottoms coincide with peak panic, but bottoms actually represent final capitulation rather than maximum fear. This is why we can’t rely on panic measurements alone—we must also analyze how panic behavior changes from its peak to generate timely bull market signals. This is exactly what ALGO1 and ALGO2 do. ALGO1 occasionally signals a few days before the final bottom, while ALGO2 occasionally signals a few days after. Why use two algorithms? Because neither detects every bull market on its own, but together they eliminate nearly all false positives and false negatives.
- ALGO1: Triggers when peak selling is followed by mild buying pressure. This approach is timely but can occasionally signal before additional lower lows occur.
- ALGO2: Triggers when peak selling is followed by peak buying. This approach signals slightly later but is less prone to future lower lows.
You can see the Panic Flush Count in relation to the S&P 500 and the ALGO1 and ALGO2 signals below:
The table below shows the actual lead/lag times, true/false positives, detection rates, and signal confidence for each algorithm:

For ALGO1, Total actual ALGO1+ ALGO2 opportunities: 12 stock market bottoms. Correct identifications: 9 true positives (caught 9 of the 12 bottoms.) Missed opportunities: 3 false negatives (missed 3 bottoms.) False alarms: 2 false positives (signaled when there was no bottom.) Accuracy metrics: Detection rate (true positive rate): 9/12 = 75% (detects 75% of actual bottoms.) Confidence (precision): 9/(9+2) = 9/11 = 81.8% (when it signals, it’s correct 81.8% of the time.) So ALGO1 catches 75% of actual bottoms and has 81.8% confidence when it does signal.
For ALGO2, Total actual ALGO1+ ALGO2 opportunities: 12 stock market bottoms. Correct identifications: 9 true positives (caught 9 of the 12 bottoms.) Missed opportunities: 3 false negatives (missed 3 bottoms.) False alarms: 1 false positives (signaled when there was no bottom.) Accuracy metrics: Detection rate (true positive rate): 9/12 = 75% (detects 75% of actual bottoms.) Confidence (precision): 9/(9+1) = 9/10 = 90.0% (when it signals, it’s correct 90% of the time.) So ALGO2 catches 75% of actual bottoms and has 90% confidence when it does signal.
In general, ALGO1 is the superior model for timeliness but has slightly lower confidence (when we see a signal, is it genuine?). Although ALGO1 and ALGO2 share the same detection rate (both identify 75% of valid opportunities), ALGO2 offers higher confidence at the expense of much later signaling. Interestingly, each algorithm identified 1-2 opportunities the other missed. You can also use ALGO2 as a ALGO1 confirmation signal that occurs later and reinforces that a new bull market has begun—potentially prompting you to increase your stock market positions.
3.OctaEDGE-1 (Conviction) Model
There are eight OctaEDGE trough models that use sustained absence of new highs to identify significant stock market bottoms. Our research has shown that new highs exhibit consistent behavior around major market bottoms: they collapse as investor conviction evaporates. Critically, this collapse in conviction reaches its peak at the absolute trough, unlike traditional panic-driven measures used by market technicians such as new lows, which typically peak before the actual bottom forms. This timing difference makes the absence of new highs a more precise indicator for identifying true market bottoms:
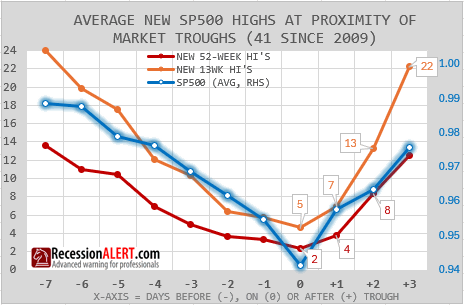
We can see from above that conviction, as measured by new highs, steadily collapses as the stock market corrects, bottoms alongside the stock market, and then explodes higher within a few days at a far more rapid rate than it declined. This pattern in new highs—steady collapse, bottoming, followed by rapid explosive recovery—is the hallmark behavior that OctaEDGE1 deploys to issue market buy signals.
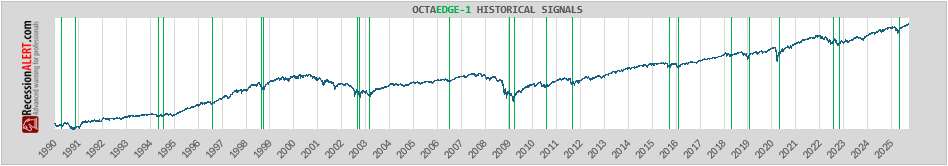
OctaEDGE-1 generates the most signals of all our high-confidence models and has excellent detection and confidence rates. It signals sooner than ALGO2 and all our other models but with a longer lag than ALGO1. The other seven OctaEDGE models are progressively more timely but generate fewer signals and are better suited for short-term and medium-term traders. For our collection of major stock market bottom models, we believe OctaEDGE-1 offers the best balance of signal frequency, minimal lag, and confidence (few false positives) for detecting significant bottoms.
The historical signalling of the OctaEDGE-1 model is shown below where it demonstrates startling performance:
The table below shows the actual lead/lag times, true/false positives, detection rates, and signal confidence for each algorithm:
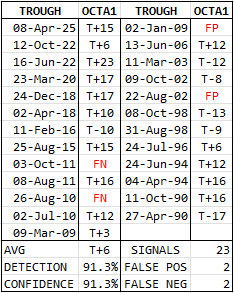
Total actual opportunities: 25 stock market bottoms. Correct identifications: 23 true positives (caught 23 of the 25 bottoms). Missed opportunities: 2 false negatives (FN, missed 2 bottoms found by ALGO1 and ALGO2). False alarms: 2 false positives (FP, signaled when there was no bottom or new lows ensued after signal). Accuracy metrics: Detection rate (true positive rate): 23/25 = 92% (detects 92% of actual bottoms). Confidence (precision): 23/(23+2) = 23/25 = 92% (when it signals, it’s correct 92% of the time).
In conclusion, OctaEDGE-1 offers several advantages over ALGO1 and ALGO2: it generates more signals, covers a longer historical period, signals more promptly (with less lag), and achieves higher detection and confidence rates. However, it did miss two opportunities that ALGO1 and ALGO2 successfully identified.
4. Price Escape Velocity (PEV)
This is one of our newer models that examines all major stock market bottoms throughout history to identify multiple price action patterns simultaneously meeting minimum thresholds. For example, one pattern requires at least four one-day advances exceeding 0.5% and at least 3 one-day advances exceeding 1.5% within a six-session period. Each pattern measures a different form of extreme upward price movement that occurs exclusively near major bottoms and enduring enough to give the new bull market enough escape velocity. Remarkably, stock market troughs have exhibited consistent extreme price action patterns across decades.
The historical signalling of the PEV model is shown below:
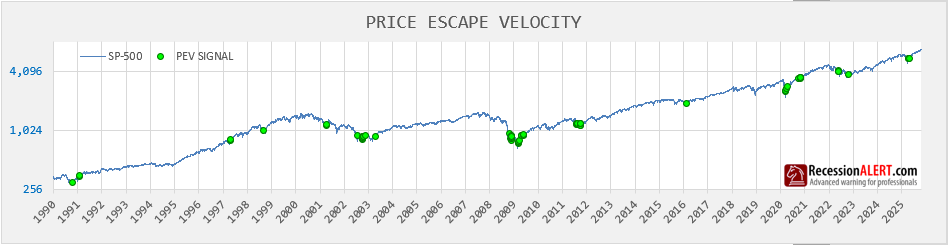
Unlike the models we have viewed so far, PEV has a tendency to cluster signals. There are 63 total PEV signals distributed across 29 signal clusters. Of these 29 clusters, only 20 are valid, with 9 being false positives that led to lower lows in the ensuing days or weeks. Regardless of the PEV clustering behavior, the optimal approach is to treat the first signal in each cluster as the primary signal, with subsequent signals serving as continuation, confirmation, or emphasis.
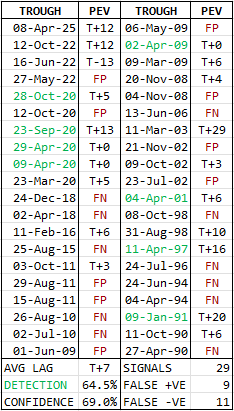
The valid trough opportunity space from all ALGO1/2 and OctaEDGE-1 signals that were not false positives totals 23, with PEV identifying an additional 8 valid troughs marked in green in the table above. This demonstrates the value of using multiple models for trough detection, as each model identifies unique opportunities the others miss. We can now calculate PEV efficacy as follows:
31 (23+8) actual bottom opportunities
20 opportunities detected (generated signal clusters)
11 opportunities missed (no signals or false negatives)
9 false positive clusters (signaled when no valid bottom existed)
Detection rate : (true positive rate): 20/31 = 64.5% (detects 64.5% of actual tradeable bottoms)
Cluster confidence rate: (precision): 20/(20+9) = 20/29 = 69.0% (when the model generates a signal cluster, it’s correct 69% of the time)
Summary: The model detected 64.5% of valid market bottoms, generating signal clusters with 69% confidence. When signals appear, there’s approximately a 7-in-10 chance they represent a genuine bottom that doesn’t lead to lower lows later. Although PEV identifies many new opportunities with very small lags, it has more false positives, lowering its confidence rate to the 70% range compared to the 80-90% range for ALGO1/2 and the 92% range for OctaEDGE-1.
5. OPTIMUM Macro resistance breakout model.
This model focuses purely on rare, ultra-high-confidence signals for new bull markets. The model’s methodology is simple: during a bear market, it targets a resistance breakout level that has never produced a false positive in the past. Remarkably, this model has never missed a valid new bull market signal since 1945—achieving zero false positives and zero false negatives throughout its entire history.
This exceptional reliability comes at the cost of signal frequency and lag. New bull markets emerge only every few years, sometimes a decade apart, and the model may signal weeks or even months after the actual bear-market bottom once markets achieve the necessary breakout momentum. But even though it can be lazy in signalling, it mostly only costs 10% of the bull market but never more than 30%, and this is the cost of supreme confidence and you thus never regret the signal. It’s a true “Halley’s Comet” signal: something that rarely appears but, when it does, demands attention.
Its historical signals appear below:
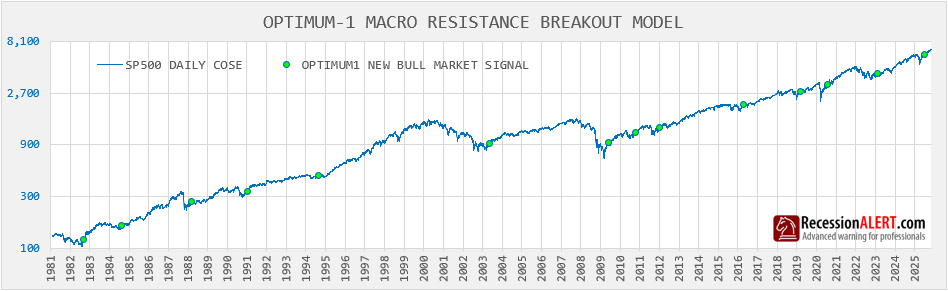
Below is a tabular log of the signals against the trough dates of major bear market bottoms, and from this we see the average signal appear 52-55 market sessions after the absolute trough:
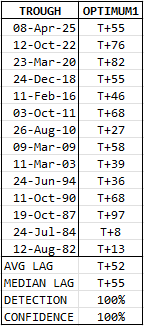
You will note that the 2009 to 2020 bull market actually issued 5 signals and if we consider 2020 to 2025 as a single bull market, it gave 3 signals so far. It is likely that as the market has aged , volatility and market-cap concentration has increased leading to intra-bull signals. For this reason it is wise not to write the model off if you consider us to be in a bull market as it can issue very productive intra-bull “continuation” signals as shown above since 2009.
6. Zweig Breadth Thrusts (ZBT’s)
The Zweig Breadth Thrust is a momentum indicator developed by legendary investor Martin Zweig, popularized in his classic book “Winning on Wall Street“. It identifies explosive rally potential in the stock market. It measures the speed and strength of market breadth expansion by calculating the 10-day exponential moving average of the ratio of advancing issues to total issues (advancing plus declining). A Zweig Breadth Thrust signal occurs when this indicator surges from an oversold level (below 0.40) to an overbought level (above 0.615) within a 10-day period. This rapid shift from extreme selling pressure to extreme buying pressure has historically indicated the start of powerful bull market rallies. The indicator is designed to catch “breadth thrusts”—rare moments when market participation explodes and pessimism rapidly transforms into optimism.
Since its creation, the Zweig Breadth Thrust (ZBT) has gained legendary status among technical analysts due to its rarity and remarkable accuracy. Signals are exceptionally uncommon, occurring only a handful of times per decade, which makes each occurrence particularly noteworthy. When triggered, it has historically preceded significant multi-month or multi-year bull market advances. The indicator’s popularity stems from its ability to identify high-probability inflection points with minimal false positives, making it one of the most respected breadth indicators in technical analysis.
Since the book’s publication in 1986, only four genuine Zweig Breadth Thrusts have occurred through 2013, making each signal a significant market event. However, this extreme rarity means investors can miss numerous strong entry points while waiting for these infrequent signals—a serious lost opportunity problem. In fact from 1984 to 2004 the ZBT suffered a drought, with no signal for 20 years.
In 2013, RecessionALERT published groundbreaking research to address this issue by developing complementary “ZBT-A” signals with modified thresholds that generate more frequent, actionable signals while maintaining high accuracy. You can read the full analysis in one of the most read research notes on our site over the last decade at “Zweig Breadth Thrust Redux.” From this research note we see historic ZBT-A signals:
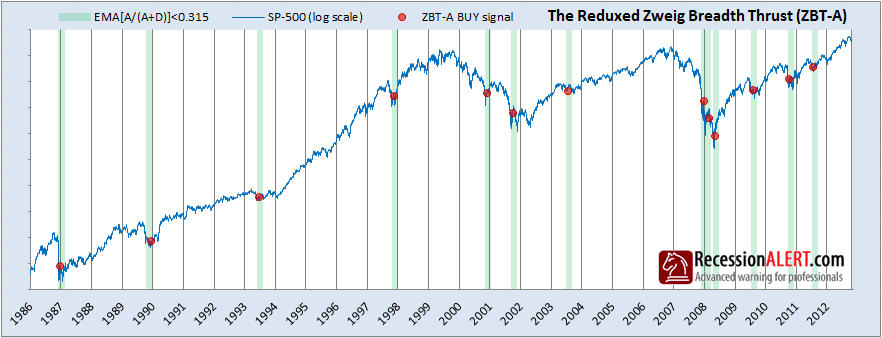
We see that significant bottoms were nicely flagged from 1986 to 2009 but the post 2008 signal rate seemed to increase somewhat. Sure enough, looking at post 2008 signals below our suspicions are confirmed, meaning this breadth metric is highly sensitive to increased market volatility since the Global Financial Crises bear market:
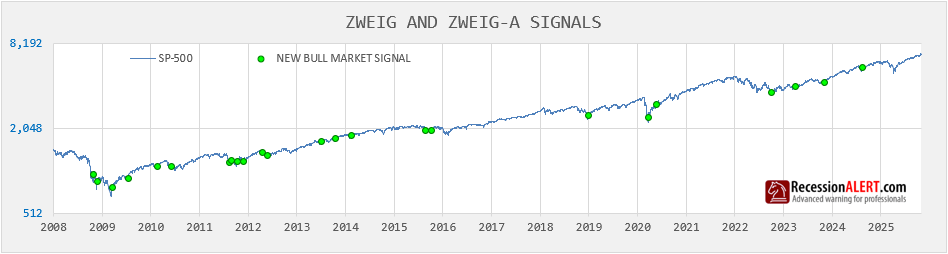
There have been 24 signals since 2008, far more prolific than all other signals in the MEGA collection. Nine of these were false positives (37%), giving the model a confidence rate of 62.5%. However, many trough opportunities are still missed, most notably the April 2025 trough, indicating a high false negative rate. It appears this model has become far more sensitive to market volatility or structural changes in advance/decline breadth metrics (more large-cap concentration) and now functions more as a short-term trough detector rather than a significant trough detector. As such, it has the lowest confidence rate in the MEGA cluster. However, due to its popularity in the stock market community, we have retained it in the collection.
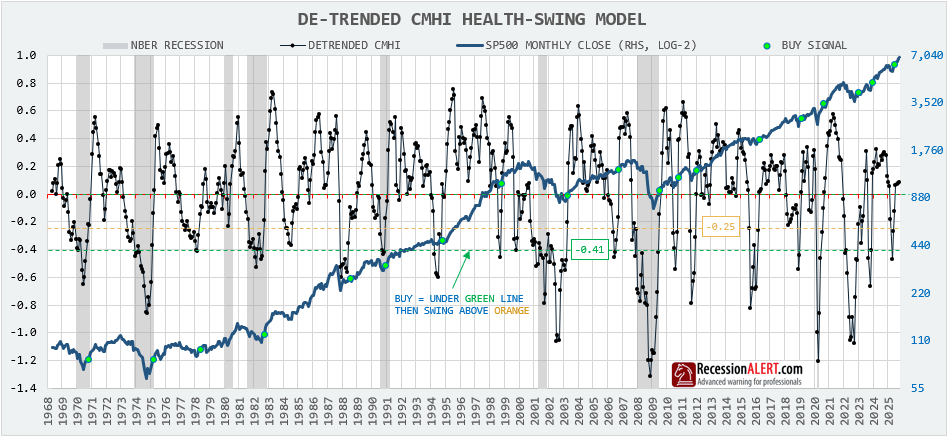
7. CMHI Swing model
The Composite Market Health Index (CMHI) is one of the oldest indicators built by RecessionALERT, introduced in the research note “Seven Paw-Prints of the Bear.” It was initially designed to accomplish what was—and still is—a very challenging task: identifying markers for the onset of bear markets. Despite identifying seven diversified metrics that reliably warned of bear markets, we discovered that combining them into a single equally weighted composite index (the CMHI) offered additional utility as an overall gauge of stock market internal health.
Some years later, an improved version with detrending was introduced, paving the way for other useful functions. Today, the CMHI is updated on a daily, weekly and monthly basis for subscribers and offers the following capabilities:
- Expression of varying degrees of stock market health (bullishness or bearishness)
- Warnings of the onset of stock market weakness or vulnerability
- A reliable new bull market indicator (of interest to us now)
- A robust quantitative macro market timing tool (Optimum-CMHI)
Regarding new bull market signals, the historical chart below shows how the CMHI composite index generated 19 high-confidence bull market signals since 1968. The idea is that stock market health, measured by seven internals, swings from an extremely bearish reading (below -0.41) to a moderately bearish reading (above -0.25) within a short period. Confirmation signals follow when the CMHI composite then swings above zero into bullish territory. This example uses monthly close prices, though subscribers can also deploy versions with daily and weekly granularity to get earlier signals:
A table of the 19 significant bottoms detected, along with their month of occurrence, month of signal, percentage gain from trough to signal, and signal lag (in months), appears below:
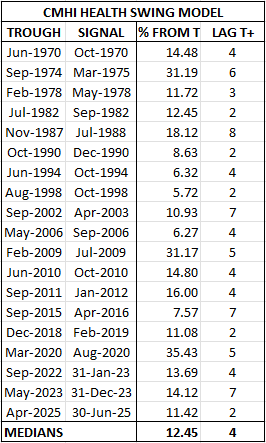
On average, the monthly model issues signals four months after the market trough, once the market has recovered 12.45% from bear market lows. The daily and weekly CMHI models are obviously much more timely but introduce more false positives due to their higher granularity. For practical purposes, the monthly model produced zero false positives or negatives, although two of the 19 signals (October 1988 and September 2006) were issued mid- to late-bull market during sunset phases. Interestingly, the signals in 1970, 1974, 1982, 1990, 2009, and 2020 were all issued one month after the end of those recessions (i.e., in the first month of business cycle expansion).
For the MEGA cluster, we use daily un-trended CMHI prints for more timely signals. However, as you can see below, these 17 earlier signals since 1990 come at the cost of three false positives, meaning our signal confidence is (17-3)/17 = 82%. There is one signal tagged in orange in October 2023, which occurred five days before the actual trough and led to a small 2% drawdown—making it very debatable whether it’s a false positive.
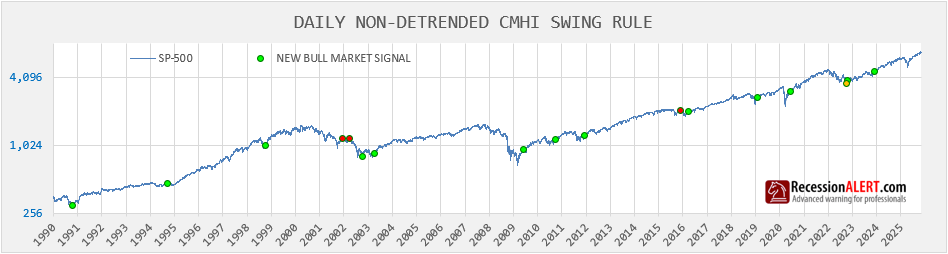
The table below depicts the complete set of 43 signals observed since 1990 from ALGO 1/2, OctaEDGE, and PEV. While it is clear that the daily CMHI model misses many opportunities—due to a high false negative (FN) count, identifying only 35% of all opportunities—the 82% confidence level is reassuring. Moreover, the model introduced four additional opportunities into the mix, as shown by the green dates below. However the average lag of T+17 is much higher than OctaEDGE (T+6) and PEV (T+7) but lower than the Optimum macro model (T+52). So it has a mix of lower short-term signal lags and lags associated with the more macro trough models. It is a macro model with with a sprinkling of intra-bull signals.
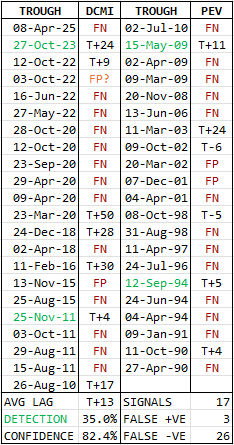
In reality it is unfair to compare this model to the OctaEDGE signal universe for detection capability (as it is a quieter macro model) and if we were to compare it to the OPTIMUM-1 “gold standard” universe of macro bull market signals then the table then detection rates jump into the 80% range.
8. The 50DMA breadth-thrust model
The percentage of SP500 stocks trading above their 50-day simple moving average has been a favourite of investors for quite some time now. The indicator has a multitude of uses worthy of a research note on its own. For the purposes of our current topic however, we are focussed on the detection of significant stock market bottoms and for this we wait for the breadth metric to rapidly swing from extreme lows typically found near large stock market bottoms to extraordinary highs some two to three standard deviations above the long-term mean. This rapid switch from depressed levels to extremely high levels are the kind of breadth thrusts that launch new bull markets.
The historical chart below shows the 14 buy signals issued by this model since 1990. They are superb quality with one false positive and one debatable false positive (orange dot). Depending if you treat the orange dot as a false positive or not, this model has a signal confidence of 85.7% to 92.8% and only recorded a single false negative (April 2025) for major stock market bottoms. This is excellent and qualifies the model for inclusion in our MEGA signals category:
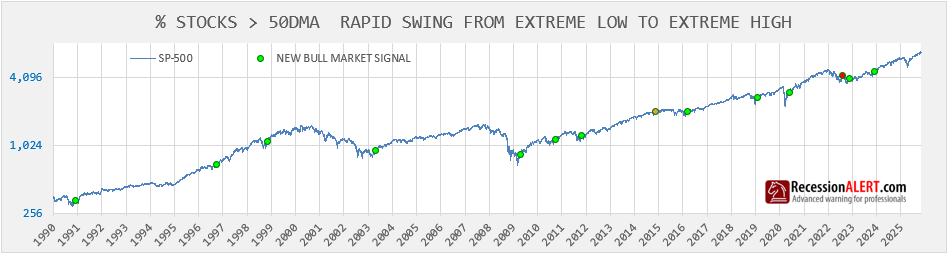
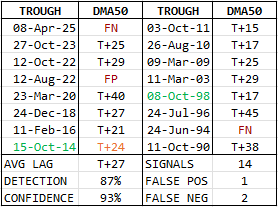
The table below depicts all the signals and lags and we note that although the average lag is 27 days, this is almost half the lag of the OPTIMUM-1 model which is considered a “gold standard” macro trough detector with 100% detection and confidence. This compares to the 87% detection and 93% confidence of the DMA50 model – not a bad compromise for half the lag times. Again we see the introduction of a new model sneaks in 2 more unique trough detection opportunities.
9. Ranking the models
A trough detection model can be scored on its signal frequency (number of opportunities it provides), its confidence rate (percentage of signals that are accurate), and its signal lag (how timely it is). For the purposes of this evaluation, we have a collection of models offering more than enough signals in combination, so we will focus on determining which are the most powerful models using confidence and lag measurements only. To do this, we rank each model for its confidence (higher is better) and its signal lag (lower is better), then combine these rankings in an equally weighted fashion to derive a final rank or “power score.”
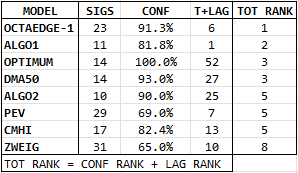
It comes as no surprise that OctaEDGE-1 is the flagship signaling model, with its high confidence and low signal lag. The fact that it is also the third most prolific signaler in the group is remarkable, and if we were to include signal rate in the evaluation, it would extend its lead over the others even more. ALGO1 ranks second, mainly due to its near-zero average lag (composed of both positive and negative lags). The OPTIMUM macro model ranks third despite having the highest lag, as it has a 100% historical confidence rate with zero false positives. The DMA50 model ties 3rd place with OPTIMUM due to having half the OPTIMUM lags with only a small sacrifice in confidence rates. ALGO2, PEV and CMHI share 4th place and ZWEIG is ranked 5th
10. Using the models together
Although we have confidence rates and lags to help us assess the potential efficacy of a signal, there is another dimension we can use to evaluate opportunity: how many of the models are firing together or are in agreement at any point.
In the top pane in your MEGA chart, we track how many of the 8 models have presented a signal in the last 15 market sessions (15-day MEGA SIG count) to enable us to assess the breadth of agreement and strength of conviction among our models. The individual models are then presented in the 8 panes below that so you can see which models have fired:
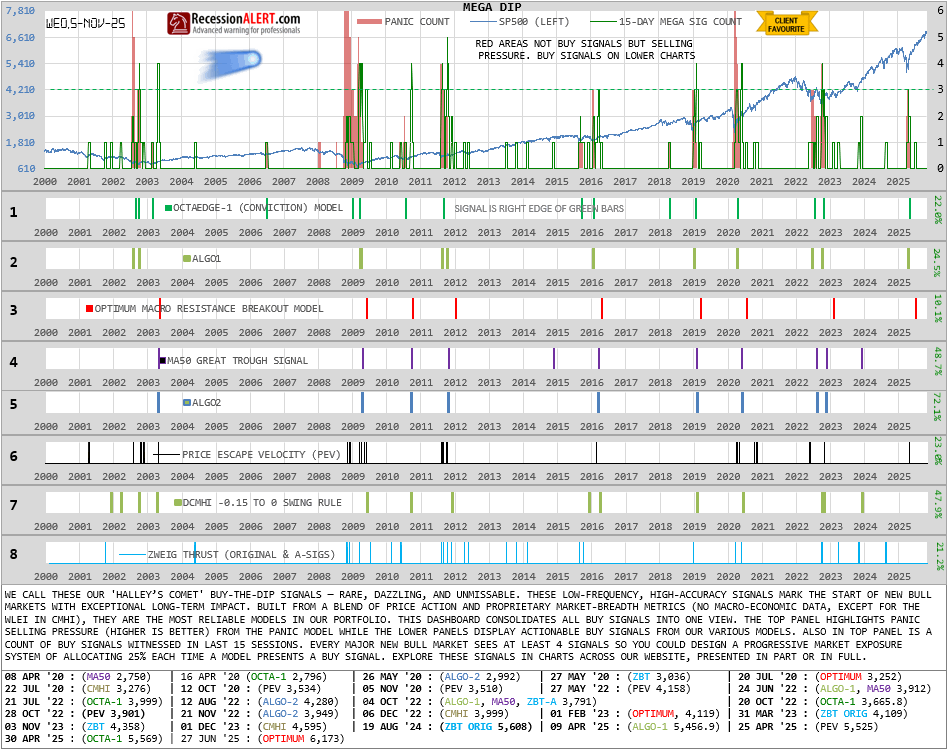
We have determined that agreement among three to four of the models offers very high-confidence signals, and every recessionary bear market since 1990 has been characterized by the model agreement count exceeding a reading of 3.
Rather than wait for the count to reach your desired threshold, it is advised to deploy funds in tranches (for example, 25% increments) into the market each time the count rises, so that by the time the count reaches 4, you are 100% invested. This is a better risk-adjusted approach than full deployment upon a signal reaching a set value, since there is risk the signal might not reach your target and you miss the opportunity altogether. You also need to bear in mind that lags will start increasing the longer you wait to deploy.
NOTE : [Table still to follow of long-term historical MEGA sig counts (2, 3 and 4) and their respective signal & false positive counts, confidence percentages and signal lags]
Comments are closed.