
In PART-1 we looked at how we used the RAVI to determine 10-year ahead forecasts on the SP500 Total Return Index with a better than 0.89 correlation, and how we managed to derive 5,3 and 2 year ahead SP500 forecasts with correlations of 0.8, 0.68 and 0.55 respectively.
In PART-2 we are going to focus solely on how we derive 1-year ahead forecasts for the Sp500.
2. Deriving 1-year SP-500 forecasts
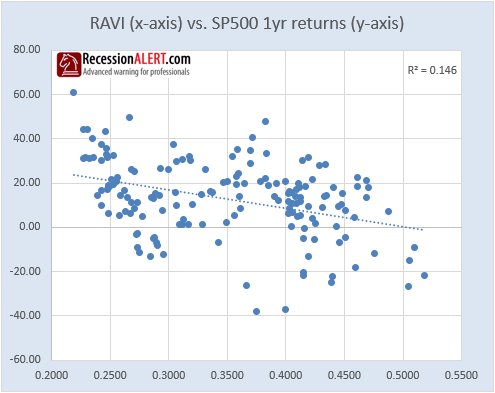
Using the RAVI index regressed to 1-year ahead SP500 growth yields a correlation that is virtually useless:
We are going to try our standard trick demonstrated in Part-1 of this research by going back in time and using x=9 in the proposed formula below:
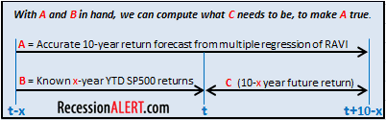
To recap, we go back in time 9-years and see what the (presumably accurate) 10-year forecast was (A). We then look at the SP-500 gains achieved during the last 9-years (B). We can then deduce what the next 1 years return C will need to be by calculating the remaining gains/losses the SP500 needs to make to ensure that the target A implied by the 10-year forecast from 9-years ago is ultimately met:
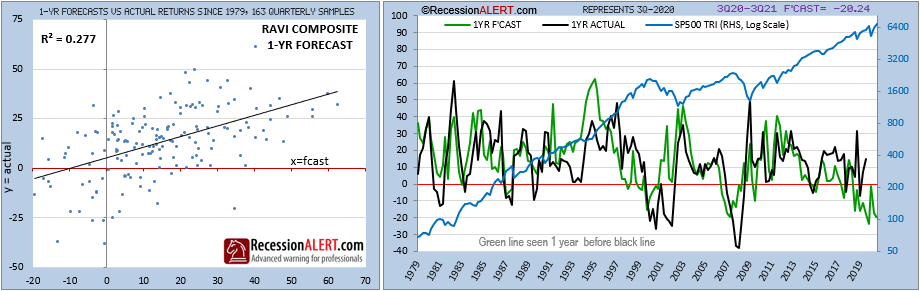
The trick works as expected – we almost double the forecast accuracy from the straight regression (correlation of 0.146 to 0.277). Whilst this is probably the best correlation we have ever witnessed for a metric against 1-year ahead SP500 returns, it would be nice to get it even higher.
INCREDIBLE OFFER : Get 50% discount off our annual PRO Subscription, PLUS order before 1 December and get a second year completely FREE. Get your discount HERE
Let us try another technique, whereby we take the reasonably accurate three-year forecast model (r-square = 0.68) and simply annualize the results to derive the one-year ahead forecast:
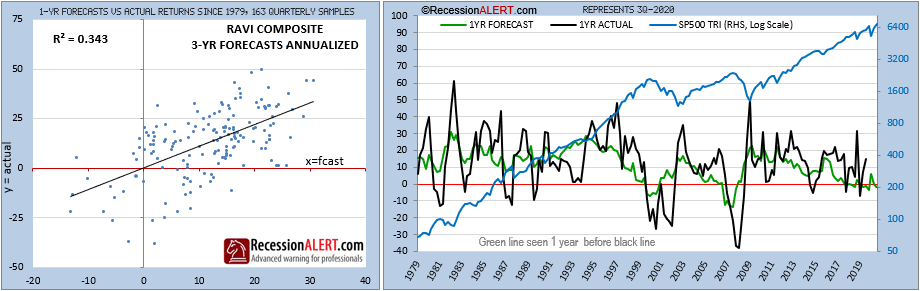
This is a very encouraging result, as an improvement of correlation from 0.277 to 0.343 is not insignificant. But perhaps annualizing a 3-year forecast leads to too much smoothing effect. Let us try the same trick by annualizing the 2-year ahead forecasts, which had a 0.55 correlation to 2-year subsequent returns. Perhaps the shorter term horizon will lead to less smoothing and better correlations:
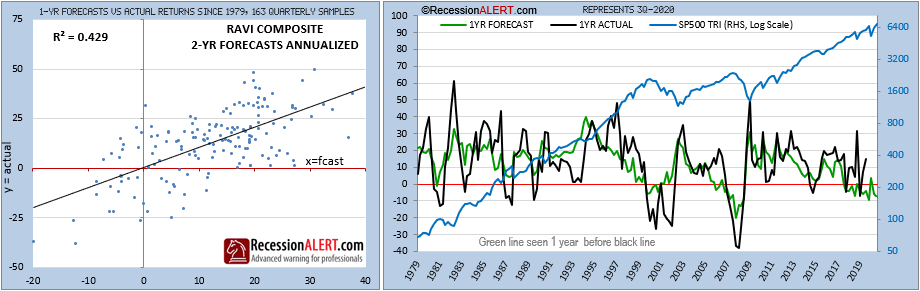
This is a truly remarkable achievement as improving 1-year forecast correlations from 0.146, to 0.277 and then to 0.429 is nothing to sniff at. We really challenge you to go find a fundamental (or even non-fundamental for that matter) metric that can forecast one-year ahead SP500 returns with an accuracy of better than 42.9% since 1979.
Let us combine all the three different one-year forecast models together onto one chart, together with their average:
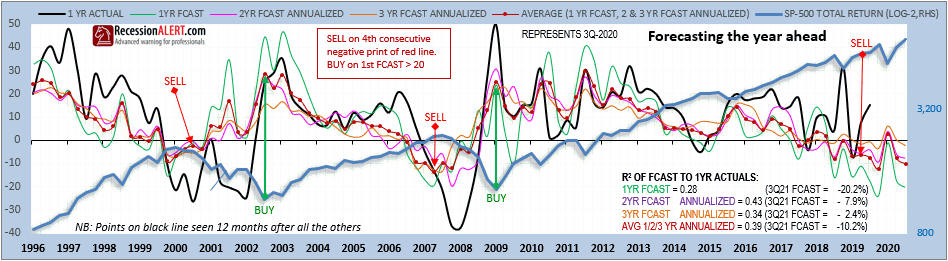
Whilst historically, the 2-year forecast (annualized) has consistently provided the higher 1-year forecast correlations, the average of all 3 forecasts (AVG 1/2/3 YR) also provides a respectable correlation, but is more useful from a signaling aspect. To wit, the guidance is to issue a major macro-level SELL signal on witnessing the fourth negative print from AVG 1/2/3 and a major BUY signal on witnessing the first print above 20%. Bear in mind the data is one-quarter lagged so you have to shift the signals ahead one quarter on the timeline to get a feel for real-time observations and action timing points. Regardless of the lag, these are still excellent entry and exit points.
In PART-3 we will look at how we measure the actual daily (real-time) risks we currently face as depicted by the 10, 5, 3, 2 and 1-year models. This allows us to participate in the massive liquidity-fueled rally, whilst being able to acknowledge, accept and understand our exact downside risk so that we can mitigate accordingly.
INCREDIBLE OFFER : Get 50% discount off our annual PRO Subscription, PLUS order before 1 December and get a second year completely FREE. Get your discount HERE
Note to subscribers:
Paid subscribers can obtain the detailed quarterly RAVI PDF report from the REPORTS section of the website, under the MARKETS tab.
They can also view daily updated measurement of near-term stock market risk (potential 1/2/3/5/10-year upside/downside to fair value) in the Dashboard in the RAVI FORECASTS tab.
Comments are closed.