Rare sightings of bullish market & macro data
LIMITED CONTENT PUBLIC VERSION
In a sea of negative macro and leading data, we embark on a hunt for signs of data that point to us being in a bull market for stocks in the U.S. Simply because it’s important to maintain a balanced weighted-evidence viewpoint and because the data is overwhelmingly negative now, putting us at risk of confirmation bias.
Near the proximity of major market and economic cycle turning points, the water often becomes muddied with all the cross-currents of conflicting information as data turns from overwhelmingly bearish to somewhat bullish and vice versa and thus it can be useful to keep tallies of bullish versus bearish metrics to try make sense of it all.
It is important to understand that bearish data currently outweigh bullish data 3:1 and although many of the below sightings may look highly impactful and important on their own (or even collectively), you must remember the bullish macro-data set is in the minority. Additionally, a syndrome of long-term historical pre-conditions for major recessionary bear market bottom in stocks have yet to make an appearance, namely a rise in unemployment, a fed pivot and a yield curve un-inversion to name but a few.
#1 : UNEMPLOYMENT
This is the most important thing to our mind. Labor continues to be “the last man standing” in a sea of negative leading macro. The item below is in fact one of the 8 factors from our U.S Cyclically Sensitive Labor market Composite. Using state-wide unemployment data in the fashion shown below actually makes it a pretty good leading indicator (for future unemployment rises as well as recessions) whereas unemployment data on its own is coincident to lagging.
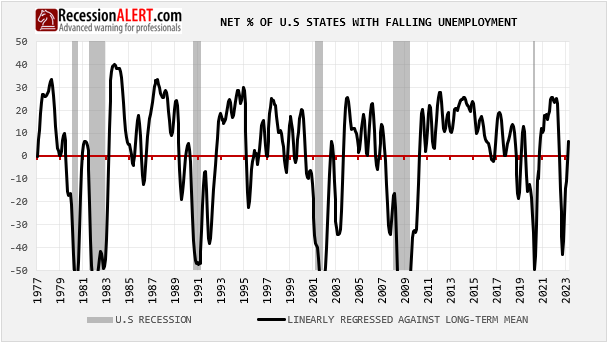
Although this one factor appears highly positive, remember there are 7 others that are negative in the Cyclical Labor Market Composite:
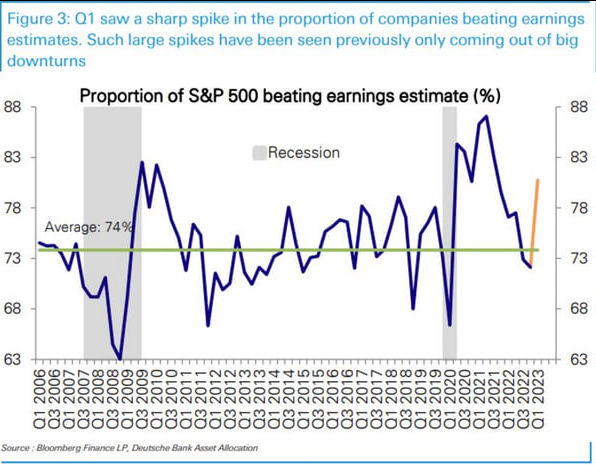
#2 : EARNINGS ESTIMATES
This is an interesting sighting – although we have always viewed indicators based on “forecasts” or “estimates” with less import than hard data due to the human subjectivity and error factor…
#3 : GLOBAL LEADING DATA
We were surprised to see this whilst updating our Global Economic Report. As we have stated in the past, while the % of OECD countries with rising LEI’s is a great leading indicator for the global (and hence the US) economy, over the decades since we have been updating this data, we have noticed it can occasionally be heavily affected by revisions, especially around turning points (and hence cautioned to wait at least 3 months to confirm trends). The most recent print was obviously a case in point where we went from a low percentage in the Feb/March prints and revised to a much higher percentage now. We’re going to observe for a further 2 months to see if the current trend is “locked-in.”
#4: 200MA TECHNICALS
This is not quite a leading indicator, but widely followed by many and makes a compelling argument among the technical analysts. Firstly, the SP500 has managed to spend over 6 weeks above the 200-day moving average. Also, the SP500 200-day moving average has finally turned up after trending down since the beginning of May 2022. Going back to 1928, the SP500 was higher on an upturn in its 200-day moving average in 20 out of 20 times with an average gain of 18%.
#5: ZWEIG BREATH THRUST
Many pundits have made a noise about a recent classic Zweig Breadth Thrust in the most recent rally, citing its ability to signal a new bull market. As we show in a decade old research note “Zweig Breadth Thrust Redux” we are less than impressed with the post 1980 performance of this indicator. However, we did find a modified version of it that proved useful:
So, whilst there was indeed a recent Zweig Breadth Thrust on 31 March 2023, there was also a better Reduxed Zweig Breadth Thrust (ZBT-A) in early October 2022, a few days post the major stock market bottom that was put in. As you can see the ZBT Redux is quite adept at pinpointing major stock market bottoms:
It would be prudent at this juncture to highlight that market-breadth overall for US stocks is very weak at the moment, according to many metrics such as % stocks trading above 50 and 200-day moving averages, small/caps to large caps ratios, advance-decline lines, 52week highs and lows and so forth.
#6: WEEKLY LEADING ECONOMIC INDEX
The RecessionALERT high-frequency weekly leading Economic Index (WLEI) seems to have put in a bottom and is nearly with its head above water again:
Note that the Weekly SuperIndex above and most monthly leading data (below) have yet to follow suit, however:
#7: PROBABILITY OF LONG-TERM MACRO BOTTOM
We would classify this next item under the “technical” category as it uses no macro-economic data. Our Gen2 SP500 Probability model calculates short, medium, long-term and macro-term probabilities of market tops and bottoms when comparing size and duration of these corrections and rallies to a 25-year daily open-high-low-close history. The probability of a bottom according to the witnessed drawdown of this last correction (top pane below) was just under 80%, whilst the probability of a bottom according to the witnessed duration of this last correction (middle pane below) was over 95%. Taken together as an average (bottom pane) the probability was just shy of 90% – a level that has worked well in the past for defining major tops and bottoms:
As an aside, the levels of panic witnessed in this last correction are NOT at levels that normally accompany major recession-induced bear market bottoms when analyzing a syndrome of factors such as VIX, drawdown, % stocks above 200 and 50-day moving average and 13-week highs and lows. Normally we see all 5 these factors jointly manifest above certain thresholds at these market bottoms but in this last correction we only witnessed 3 as shown below:
#8: STOCK MARKET HEALTH
Our oldest collection of U.S stock market health metrics, encapsulated in the Composite Market Health Index or CMHI (see the research paper “Seven paw-prints of the bear“) has been staging a recovery from classical bear market levels, but appears to be stalling out as has happened on occasion in the past in the dotcom recession and the global financial crises:
Two of the seven metrics in CMHI are “price momentum” related, three are “breadth related”, one is macro-economic and another is seasonal, so it’s clear that the market breadth components are the ones keeping the CMHI below water and until strong breadth returns its likely to remain in troubled waters. The fact that persistently weak market-breadth divergences with stock market highs usually presage large corrections is not confidence-inspiring.
Want to see even more?
Sign up below with our introductory offers, where the 2-year subscriptions allow you to lock in discounts for up to 24 months: