
MIB WEEKLY DIGEST
Week of Oct 19–23, 2026
Houthi strikes on Saudi airports and Aramco sites, and Washington’s talk of a long war with Iran, pushed Brent up 6.3% to $116.62, its highest settle since April. Thursday’s AI-financing scare, set off by Lam Research’s supply-capped guidance (−11.76%) and Meta’s higher spending floor (−6.98%), handed the Nasdaq 100 its worst day since June. Treasuries took the haven bid, the 10-year falling 17.2 bps that day and closing the week below 5%, even as Friday’s surveys showed price pressure building into Wednesday’s Fed decision. CrowdStrike (+13.3%) and Palo Alto (+11.3%) led the weekly gainers, and small caps rose 2% while the S&P 500 slipped 0.5%.
TABLE OF CONTENTS
A. WEEK AT A GLANCE
B. WEEK IN MARKETS
C. WEEK’S TOP STORIES (7)
D. WEEK IN THE ECONOMY (5)
E. WEEK IN EARNINGS (3)
F. NEXT WEEK SETUP
G. CHART OF THE WEEK
A. WEEK AT A GLANCE -> TOP
The S&P 500 slipped 0.47% to 7,623.68 for a second straight weekly loss while the Russell 2000 gained 2.00%, as a Gulf escalation that carried Brent to $116.62 collided with a renewed AI-financing scare that cost the Nasdaq 100 2.90% on Thursday alone. Leadership broadened rather than broke, and Treasuries, not gold, took the haven bid, pulling the 10-year yield below 5%. The market heads into Wednesday’s Fed decision pricing a softer policy path even as the week’s price data ran hotter.
• Brent +6.28% to $116.62, its highest settle since April 29 and a third straight weekly gain, as Houthi strikes reached Saudi airports and Aramco sites.
• Thursday’s AI rout: the Nasdaq 100 fell 2.90%, its worst day since June 23, as Lam Research (−11.76%) and Meta (−6.98%) revived AI-financing fears; the index ended the week −0.79%.
• 10-year Treasury yield −17.2 bps on Thursday, its biggest one-day fall in nearly four years, closing the week at 4.994%, 9.6 bps lower.
• CrowdStrike +13.27% and Palo Alto +11.27% topped the weekly megacap gainers on the PHP2Shell flaws and a Friday cybersecurity rally.
• Housing broke under 7% mortgages: builder confidence fell to 29, its lowest since 2012, starts dropped 5.2% and pending sales 7.3%.
• Gold −4.30% to $4,009.70 despite the Gulf escalation, with silver and platinum at their lowest closes since at least mid-April.
1. The war is being priced as inflation, not fear — Brent rose 6.3% as attacks reached Saudi soil, yet gold, silver and platinum each lost more than 4%, the VIX ended lower and Friday’s surveys tied rising selling prices to oil, so markets are treating the Gulf as a cost shock to be absorbed rather than a crisis to hide from.
2. AI’s demand question has become a financing question — Nvidia, Lam Research and Anthropic all said supply, not demand, is the constraint, yet the market sold the suppliers and AI-power names and bought security and software, because Meta’s record default-insurance cost and OpenAI’s lower valuation put the spotlight on who pays for the build-out.
3. Bonds and the data are pointing in opposite directions — the 10-year fell 9.6 bps and futures cut December hike odds to 76% from 87% on a haven rally, while flash PMI selling prices, Michigan inflation expectations and New York Fed services prices all firmed, leaving Wednesday’s Fed decision to say which one is right.
4. The physical economy outvoted the AI trade — small caps rose 2%, the Dow and transports finished higher as Union Pacific reported 6% carload growth, jobless claims stayed below 200,000 and the PMI’s output gauge pointed to 5% growth, so outside housing and megacap tech the week’s evidence was of an economy still expanding.
 — Leading economic indicators. Accurate market forecasts. Apply for membership at join.recessionalert.com
B. WEEK IN MARKETS -> TOP
Two shocks hit the same week and the market absorbed both without breaking. Houthi strikes moved from Saudi oil fields to its airports and Aramco sites, Iran claimed control of Hormuz traffic and Washington began talking about a long war, carrying Brent to its highest settle since late April. In between, Thursday’s AI-financing scare — Lam Research’s supply-capped guidance landing on Meta’s raised spending floor — gave the Nasdaq 100 its worst session since June and wiped out three days of gains. Leadership broadened rather than collapsed: small caps rose in four of five sessions, and the Dow and the transports finished higher while megacap tech gave ground. The tell was in havens. Treasuries took Thursday’s flight-to-safety bid and the 10-year closed the week below 5%, yet gold and silver slid alongside the oil spike, so the war is being priced through inflation and rates, not fear.
FRIDAY CLOSE & WEEK-ON-WEEK CHANGE — Fri, Oct 23, 2026:
MAJOR INDICES
Small caps carried the week: the Russell 2000 rose in four of five sessions and outran large caps by 2.5 points, broad participation that reversed last week’s slide to an April low even as Thursday’s Nasdaq 100 rout kept the headline index negative. Dow Theory stayed in bull confirmation, and Thursday produced the week’s sharpest split, with transports jumping on CSX and Union Pacific results while the Dow sat flat. Large caps and the Nasdaq 100 finished within half a point of each other, so the money moved from megacaps to small caps, not from growth to value.
| Index | Fri Close | WoW Change | WoW % | Why It Moved (Week) |
|---|---|---|---|---|
| S&P 500 | 7,623.68 | −35.76 | −0.47% | A second straight weekly loss: three up sessions to Wednesday’s 7,757.17 high were erased by Thursday’s AI-hardware rout (−1.21%) and Friday’s oil-driven blue-chip slide. |
| Dow Jones | 52,215.16 | +212.75 | +0.41% | Healthcare, 3M and IBM lifted it back above 52,000 on Tuesday and Wednesday; Friday’s 653-point drop on American Express and staples gave back most, not all, of the gain. |
| DJ Transportation | 20,041.91 | +162.08 | +0.82% | Rails did the lifting: CSX (+6.76%) and Union Pacific (+3.55%) results drove Thursday’s 1.87% gain, and airlines rose Tuesday as crude dipped, before Friday’s oil jump took back 1.24%. |
| Nasdaq 100 | 28,957.53 | −230.02 | −0.79% | Climbed 2.2% into Wednesday on the chip rebound and Nvidia’s supply-chain push, then lost all of it Thursday as Lam Research’s capped guidance and Meta’s raised capex floor revived AI-financing fears. |
| Russell 2000 | 2,775.90 | +54.53 | +2.00% | Rose in four of five sessions, led by Tuesday’s 1.65% broadening day, and sidestepped Thursday’s megacap rout as the 10-year yield fell. |
| NYSE Composite | 24,117.27 | +28.64 | +0.12% | Defensive, healthcare and rate-sensitive breadth kept the broad index positive through Thursday’s tech selloff; Friday’s broad decline trimmed it to a fractional gain. |
VOLATILITY & TREASURIES
The curve bull-flattened over the week, with 2s10s narrowing from 37.5 to 30.8 bps as the long end did most of the work. Thursday was the whole story: with crude jumping and jobless claims beating, the 10-year still dropped 17.2 bps as AI stocks broke, the signature of a risk scare rather than an inflation one. Friday clawed back just a quarter. The VIX still ended lower after two spikes and the dollar was flat, so the only haven bid of the week went to Treasuries.
| Instrument | Fri Level | WoW Change | Why It Moved (Week) |
|---|---|---|---|
| VIX | 19.45 | −0.53 (−2.65%) | Fell to 16.68 by Wednesday, jumped 14% in Thursday’s AI rout and still ended slightly lower on the week; equity volatility did not price the Gulf escalation. |
| 10-Year Treasury Yield | 4.994% | −9.6 bps | Thursday’s 17.2 bp haven drop, the benchmark’s biggest one-day fall in nearly four years per Reuters, took it below 5%; Monday’s climb to 5.145% and Friday’s 4.3 bp rebound bracketed the move. |
| 2-Year Treasury Yield | 4.686% | −2.9 bps | Held at 4.78%–4.81% through Wednesday as a Reuters poll made a December hike the consensus, then fell 16 bps with the long end on Thursday; a smaller weekly drop than the 10-year, so the curve flattened. |
| US Dollar Index (DXY) | 101.82 | +0.04 (+0.04%) | Flat: euro weakness on French fiscal worries on Monday and Friday offset softer sessions on Tuesday and Thursday; no haven bid at any point. |
COMMODITIES
Precious metals did the opposite of what a Middle East escalation usually prompts: gold, silver and platinum each lost more than 4% on the week, with the slide concentrated on Thursday and Friday as crude surged. With Treasuries rather than bullion taking the haven bid, the metals traded the war as a rates-and-inflation story. Copper held up best after Friday’s rebound, and Bitcoin round-tripped a Wednesday high to finish flat, tracking the Nasdaq rather than offering an alternative to it.
| Asset | Fri Price | WoW Change | WoW % | Why It Moved (Week) |
|---|---|---|---|---|
| Gold | $4,009.70/oz | $−180.22 | −4.30% | Fell in four of five sessions, most heavily in Thursday’s broad metals selloff (−2.65%) on a day Treasury yields plunged, so rates do not explain it; the Gulf escalation drew no safe-haven buying. |
| Silver | $53.970/oz | $−3.165 | −5.54% | Thursday’s 5.35% slide, which dealers tied to fast-money selling in thin trade (unverified), and Friday’s follow-through left it at its lowest close since at least April 15. |
| Copper | $6.5000/lb | $−0.0658 | −1.00% | Firm through Tuesday, dropped 2.74% in Thursday’s metals selloff, then recovered 1.59% on Friday alongside a strong flash PMI; the most resilient metal of the week. |
| Platinum | $1,555.50/oz | $−87.15 | −5.31% | Peaked Tuesday at $1,658.75, then fell three straight sessions, including a 4.02% drop on Thursday, to its lowest close since at least April 15. |
| Bitcoin | $81,454.00 | $−183.00 | −0.22% | Rallied to $84,839 by Wednesday with the tech rebound and gave it all back in Thursday’s 3.96% slide alongside the Nasdaq 100; a risk proxy all week, with no crypto-specific catalyst. |
ENERGY
Oil moved against equities in four of five sessions, the supply-shock signature, and Brent rose in each of the last three as Houthi strikes shifted from shipping lanes to Saudi airports and Aramco sites. The seaborne benchmark carried the premium: Brent’s spread over WTI widened from about $11 on Monday to about $13.50. Gas split hardest of all, with Henry Hub falling every session on mild US weather while Dutch TTF climbed to the top of its range since mid-April, a clean US-versus-Europe divergence.
| Asset | Fri Price | WoW Change | WoW % | Why It Moved (Week) |
|---|---|---|---|---|
| Crude Oil (WTI) | $103.14/bbl | $+1.50 | +1.48% | Houthi strikes on Saudi infrastructure added more than $5 on Thursday and Friday after three soft sessions; the weekly gain understates the move because last Friday’s close was the expiring November contract and this week quotes December. |
| Crude Oil (Brent) | $116.62/bbl | $+6.89 | +6.28% | A third straight weekly gain to its highest settle since April 29: Houthi attacks on Saudi airports and Aramco sites, a reported Dhahran evacuation and Washington’s long-war talk overwhelmed Tuesday’s mediation-driven reversal from $111.99. |
| Natural Gas (Henry Hub) | $2.629/MMBtu | $−0.499 | −15.95% | Fell in all five sessions on mild weather forecasts; a slightly below-consensus 77 Bcf storage build did not stop the slide ahead of the November contract’s October 28 expiry. |
| Natural Gas (Dutch TTF) | $30.607/MMBtu | $+1.429 | +4.90% | Rose with crude’s Gulf premium to its highest close since at least April 15, as Russian officials urged the EU to reconsider its planned Russian LNG ban, citing low European storage. |
S&P 500 SECTORS — WEEKLY ROTATION
Communication Services is the structural laggard, worst on the week and the month and negative on every horizon, and its slide was single-name driven: Meta, Netflix and Alphabet all sit among the ten largest megacap decliners. Technology’s flat week hides an internal split, with CrowdStrike, Palo Alto and IBM leading the weekly gainers while Lam Research and Applied Materials were among the worst, so security and software were bought and chip equipment sold. Energy keeps its regime leadership across the one-month, three-month, YTD and 12-month columns, while Healthcare’s weekly lead was broad, with no top-five mover in the sector.
| Sector | 1-Week | 1-Month | 3-Month | 6-Month | YTD | 12-Month |
|---|---|---|---|---|---|---|
| Healthcare | +1.85% | +3.85% | +6.42% | +18.44% | +12.49% | +18.93% |
| Energy | +1.50% | +9.21% | +15.27% | +15.37% | +49.09% | +52.83% |
| Real Estate | +0.96% | +0.75% | −8.38% | −3.55% | +3.73% | −0.59% |
| Utilities | +0.69% | +7.31% | −6.47% | −8.82% | −0.87% | −5.44% |
| Consumer Defensive | +0.40% | +8.19% | +4.43% | +4.42% | +12.90% | +10.72% |
| Financial | +0.17% | +0.32% | −2.99% | +7.68% | +3.77% | +10.25% |
| Consumer Cyclical | +0.06% | +0.94% | +1.32% | −5.99% | −7.27% | −6.84% |
| Technology | −0.01% | −5.75% | +5.36% | +10.53% | +21.79% | +20.48% |
| Industrials | −1.23% | −2.81% | −6.56% | −7.23% | +5.31% | +6.82% |
| Basic Materials | −3.71% | −5.36% | −0.87% | −9.25% | +6.75% | +15.90% |
| Communication Services | −5.29% | −7.84% | −1.52% | −8.31% | −5.38% | −0.13% |
TOP WEEKLY MOVERS:
The leaderboard split along the AI supply chain rather than along sectors: four of the five gainers and two of the decliners are Technology names, which is why the sector table shows Technology flat. Buyers favoured AI’s users and defenders, in security and software, and sold its suppliers: Lam Research, Applied Materials and GE Vernova are still up 25% to 47% this year but are now in month-long corrections of 15% to 25%. The gainers split by history: CrowdStrike and Palo Alto extended runs that have more than doubled their shares this year, while IBM and Tesla bounced from year-to-date losses, counter-trend moves rather than new leadership.
TOP 5 WEEKLY GAINERS
| Ticker | Week | YTD | Year | Why It Moved |
|---|---|---|---|---|
| CRWD | +13.27% | +119.79% | +97.38% | Two linked catalysts. Wednesday’s disclosure of the “PHP2Shell” flaws in the PHP runtime, which let attackers run code on web servers without an account, set off a sector rally, and Mizuho raised its target to $275 from $250 on Thursday. Friday brought an Evercore ISI channel-partner survey pointing to firmer year-end security budgets, with CrowdStrike and Palo Alto named the leading beneficiaries of AI-driven security spending, and the stock added 8.25%. The gains reversed the prior Friday’s 7% AI-financing selloff. |
| PANW | +11.27% | +106.60% | +76.98% | Rode the same PHP-flaw rally midweek, then jumped 7.22% on Friday on the Evercore ISI survey of channel partners, which found budgets shifting toward securing data, AI, identities and cloud environments. Wells Fargo raised its target to $525 from $475 and Citigroup to $440 from $410. The move recovered a 7.6% drop on October 16. |
| IBM | +9.23% | −14.40% | −11.03% | Third-quarter results on Wednesday evening beat on both lines (adjusted EPS $2.95 vs. $2.86; revenue $17.10 billion vs. $16.82 billion), with software growth accelerating to 8% and the free-cash-flow outlook raised. The shares swung lower after hours on the unchanged revenue guide but recovered, and the stock was on course for its best week since June after the CEO said second-quarter softness was timing rather than demand. |
| PLTR | +5.76% | +10.69% | +9.01% | A Monday partnership with Knox Systems, which says it can secure FedRAMP authorization for commercial software in 90 days or less, lifted the shares 4.36% and recovered most of the prior Friday’s 7.22% drop; no financial terms were disclosed. The stock rebounded toward $200 by Wednesday, below its $213 record, ahead of third-quarter results on November 2. |
| TSLA | +4.93% | −17.23% | −17.10% | Merger talk with SpaceX drove the week: Musk said on Tuesday that both boards had formed special committees, and the stock rose into Wednesday’s third-quarter report. Results beat (adjusted EPS $0.48, $1.5 billion of free cash flow) and Tesla cut full-year capex guidance to $20 billion from $25 billion; the shares slipped Thursday, but merger-driven upgrades from CLSA and BNP Paribas Exane cushioned the decline. |
TOP 5 WEEKLY DECLINERS
| Ticker | Week | YTD | Year | Why It Moved |
|---|---|---|---|---|
| LRCX | −12.82% | +34.42% | +55.96% | Record September-quarter results on Wednesday evening (EPS $2.20, revenue $8.22 billion) came with December-quarter guidance of $8.6 billion, only slightly above consensus; the CFO said it “would have been a bit higher if not for some near-term supply chain constraints,” and management flagged a step-down in China revenue. The shares fell 11.76% on Thursday, and Needham cut its target to $290 from $390. |
| GEV | −11.53% | +24.70% | +36.94% | No company-specific news: the shares fell 10.64% on Thursday, to their lowest since March 31, as Meta’s higher spending outlook stoked AI-financing worries and pulled AI-power names lower, with Vertiv and Eaton also sliding. A Section 232 finding on wind-turbine imports landed the same day. Third-quarter results are due October 28. |
| META | −9.40% | −2.65% | −12.45% | Third-quarter revenue beat, but Meta raised the floor of its 2026 capex range to $135 billion, reported negative quarterly free cash flow and unveiled a non-voting Class C share that investors read as a funding tool. The stock fell nearly 7% on Thursday, its worst day in about three months, and the cost of insuring its debt against default hit a record. A $25 billion New Mexico penalty had landed on Wednesday. |
| GE | −8.98% | −7.27% | −6.77% | Tuesday’s third-quarter beat and raise (adjusted EPS $2.25, orders up 49%) was overshadowed by a 14% fall in free cash flow, attributed to working-capital timing, along with narrower Commercial Engines & Services margins and uncertainty over GE9X certification. The shares fell 3.67% that day and another 2.69% on Friday. |
| AMAT | −7.83% | +46.79% | +65.12% | No company-specific news: it fell 8.16% on Thursday as Lam Research’s supply-constrained guidance revived worries that AI-driven chip-equipment spending has peaked, after slipping with chip-equipment peers on Tuesday. |
— Institutional-grade intelligence for serious investors. Apply for membership at join.recessionalert.comC. WEEK’S TOP STORIES -> TOP
Seven stories, three threads. The Gulf thread (#1, #7) shows escalation and response feeding each other: as attacks moved from tankers to Saudi airports and Aramco sites, Washington reached for four fuel-supply levers in five days. The AI thread (#2, #5, #6) delivered a split verdict, with record demand and scarce capacity on one side, financing strain on the other, and security spending the beneficiary. The third thread (#3, #4) sets next week’s agenda: a bond market leaning against the Fed, and a merger that would put one controlling shareholder on both sides of a $3 trillion deal.
BEARISH
1. The Gulf War Moves Onshore: Houthi Strikes on Saudi Airports and Aramco Sites, Iran’s Hormuz Claims and Talk of a Long War Carry Brent 6.3% Higher to $116.62
The core facts:The escalation built every day. On Monday the Houthis claimed strikes on an Aramco site at Yanbu, the Shaybah oilfield and airports in Riyadh and Abha, Iran’s Revolutionary Guards said two tankers had struck mines in the Strait of Hormuz, and Saudi Arabia postponed its Future Investment Initiative conference to 2027; none of the military claims was independently confirmed. On Tuesday Brent touched $111.99 before reversing as Pakistan’s army chief, a key US-Iran mediator, met Iran’s president, while the IEA’s Fatih Birol said he saw no “credible pathway” to normalisation in 2027. On Wednesday Iran’s foreign minister said the strait would not reopen to everyone without an understanding, the State Department ordered non-emergency staff out of Saudi Arabia, and drone debris killed two near Shaybah. On Thursday a Houthi strike on King Fahd International Airport near Dammam killed two, Reuters reported Aramco told staff to evacuate its Dhahran headquarters, and Iran claimed seven tankers hit near Hormuz, which CENTCOM disputed. On Friday UN Ambassador Mike Waltz said the war could last another year and ambassador Tom Barrack said a weekend strike on Iran was possible. Brent closed at $116.62, its highest settle since April 29.
Why it matters:The risk moved from transit to source. Yanbu is the Red Sea outlet Saudi Arabia uses to bypass Hormuz, so attacks there threaten the region’s escape valve rather than a single route, and Washington’s talk of a year-long conflict pushes the expected duration of the premium out by months. The seaborne benchmark carried it: Brent’s third straight weekly gain came with a wider spread over WTI (see Energy table in Section B). What did not move is as telling as what did. MUFG said Hormuz flows are still close to pre-conflict levels, so the premium prices the risk of lost barrels rather than barrels already lost; gold fell 4.3% and the VIX ended the week lower; and the Energy sector gained only 1.5%, falling on Thursday while crude jumped. Investors are treating the war as an inflation and margin shock, which is exactly the channel that reaches Wednesday’s Fed decision.
What to watch:Any US or Israeli action against Iran over the weekend and Monday’s crude open; whether tanker traffic through Hormuz falls from near-normal levels; and ExxonMobil and Chevron results on Friday, October 30.
BEARISH
2. AI-Financing Fear Returns: Lam Research’s Supply-Capped Guidance and Meta’s Higher Spending Floor Sink the Nasdaq 100 2.90% on Thursday, Erasing a Three-Day Rebound
The core facts:The week opened with relief: the Nasdaq 100 rose 1.17% on Monday as chip stocks snapped their longest losing streak since 2008, though CoreWeave, the centre of the prior week’s rout, could not hold an early gain after a Goldman Sachs upgrade. Wednesday added another 1.13% on Nvidia’s supply-chain announcements and Super Micro’s raised outlook. That evening Meta reported record revenue of $64.6 billion but narrowed its 2026 capex range to $135-$145 billion, raising the floor, and created a non-voting Class C share, while Lam Research posted record revenue with December-quarter guidance only modestly above consensus, which management said supply constraints had held back. Thursday reversed everything: the Nasdaq 100 fell 2.90%, its steepest drop since June 23, with Lam down 11.76%, Applied Materials 8.16%, AMD 8.10%, Intel 8.04%, Nvidia 4.40% and CoreWeave 10.1%. The selloff spread to AI power, with GE Vernova down 10.64% and Vistra 9.93%, while Meta fell 6.98% and Reuters reported the cost of insuring its debt against default touched a record. AP tied the move to worries that the cost of borrowing to build data centers could threaten the AI boom.
Why it matters:The AI debate has moved from whether demand exists to who pays for the build-out, and the credit market is now part of the answer: a record default-insurance price at one of the world’s most profitable companies says lenders, not just shareholders, are pricing the capex. The market also showed how little room for disappointment is left in the supply chain, punishing Lam for guidance that merely matched expectations. Yet Thursday was a rotation, not a liquidation: about two of every three S&P 500 stocks rose that day and regulated utilities rallied while merchant power producers fell, and over the week small caps gained 2% while the Nasdaq 100 lost 0.8% (see Major Indices table in Section B). Four of the week’s five worst megacaps — Lam, GE Vernova, Meta and Applied Materials — sit on this one fault line (see weekly movers table in Section B).
What to watch:Alphabet’s and Microsoft’s capex guidance after the close on Wednesday, October 28, the same afternoon as the Fed decision, then Amazon and Intel on October 29; KLA’s results on October 28 test the chip-equipment group.
UNCERTAIN
3. Treasuries Take the Haven Bid: The 10-Year Falls 17.2 bps on Thursday, Its Biggest Drop in Nearly Four Years, and Ends the Week Below 5% on a Day Crude Jumped
The core facts:Bonds started the week against the market. On Monday the 10-year rose 5.5 bps to 5.145% while stocks bounced, and Utilities, Real Estate and the big banks led eight sectors lower; the mortgage REIT ETF hit its lowest level since April 2020. On Tuesday a Reuters poll found 94 of 100 economists expect the Fed to hold on October 28 and nearly all expect a December hike. Then on Thursday the 10-year fell 17.2 bps to 4.951%, its largest one-day decline in nearly four years per Reuters, and the 2-year fell 16.0 bps. AP said investors were buying government bonds for safety as AI stocks tumbled; the rally came on the same day Brent jumped 3.7% and jobless claims beat forecasts, two inputs that would normally push yields up. Friday recovered 4.3 bps, leaving the 10-year at 4.994%, 9.6 bps lower on the week, with futures pricing December hike odds at 76%, down from 87% a week earlier.
Why it matters:A drop of this size driven by equity risk rather than data is the bond market signalling that the AI selloff could tighten financial conditions on its own, which changes the calculus for a Fed that has been weighing more tightening with the 10-year above 5% for most of October. Rate-sensitive equities caught it immediately: Home Depot rose 4.33% and Blackstone 8.38% on Thursday. The weakness is in the foundation. The move rested on positioning, not on a change in the inflation outlook, and Friday’s data pointed the other way, with flash PMI selling prices rising at their fastest pace since 2022 and household inflation expectations at their highest since May (see Section D). The curve bull-flattened over the week (see Vol & Treasuries table in Section B), a shape that leaves the front end exposed to a hawkish surprise.
What to watch:Whether the 10-year holds below 5% into Wednesday’s 2:00 PM ET decision and press conference, then the Q3 GDP advance estimate and September PCE on Thursday, October 29.
UNCERTAIN
4. SpaceX and Tesla Edge Toward a Merger: Special Committees, Hired Advisers and a Week of Whiplash in Both Stocks
The core facts:SpaceX opened the saga on Tuesday evening with third-quarter revenue up 161% to $14.58 billion, against $12.87 billion expected, as its AI segment ($7.56 billion) overtook Starlink ($5.2 billion), and Musk said special committees at SpaceX and Tesla were discussing a merger. SpaceX rose 7.79% and Tesla 3.41% on Wednesday, while AT&T fell 6.45% after its own results, with competition from Starlink’s mobile service among the concerns cited. On Thursday Reuters reported that both companies had hired advisers and were weighing structures including SpaceX buying Tesla or a new holding company, with an all-stock deal among the options; Barclays said an announcement could come before Tesla’s December annual meeting. SpaceX fell 9.14% that day while CLSA and BNP Paribas Exane upgraded Tesla, citing merger sentiment. On Friday PhillipCapital double-upgraded SpaceX to Buy, and Reuters tied a 1.40% fall in Communication Services to a report that SpaceX is exploring a US wireless carrier program.
Why it matters:A combination of two companies worth more than $3 trillion together would put a controlling shareholder on both sides of the table, a governance test for every Tesla holder and index fund, and Musk himself has called the required approval of 50% of all Tesla shares “quite a high hurdle.” The split reaction is the signal: SpaceX holders sold the prospect of absorbing a slower-growing auto business, while Tesla’s week was carried by deal optionality rather than its quarter, leaving it among the week’s top megacap gainers (see weekly movers table in Section B). The second-order effect lands on telecoms. SpaceX’s push into direct-to-phone service is now being priced into carrier valuations, and Communication Services was the worst sector of the week (see sector rotation table in Section B).
What to watch:Any statement from either special committee and the date of Tesla’s December annual meeting; Verizon’s results on Monday, October 26, and T-Mobile’s on Wednesday, October 28, for how the carriers address the satellite threat.
BULLISH
5. Cybersecurity Tops the Weekly Leaderboard: The “PHP2Shell” Flaws and a Friday Rally Lift CrowdStrike 13% and Palo Alto Networks 11%
The core facts:On Wednesday Calif.io, Wiz, OpenAI and Quarkslab disclosed two vulnerabilities in the PHP runtime, CVE-2026-109618 and CVE-2026-109619, which affect PHP 5.4 and later and allow remote code execution or data exposure through crafted web traffic. Cloudflare said the flaws leaked before their official release and that it had already observed attack traffic against customers, and it warned that updating website code alone does not fix them. CrowdStrike rose 5.26% that day, also announcing an expanded AI-security collaboration with Nvidia, and Zscaler 7.84%. On Friday CrowdStrike jumped another 8.25% and Palo Alto Networks 7.22%, the session’s largest gains among US companies above $200 billion, on a day eight of 11 sectors fell; Investing.com tied that move to an Evercore ISI channel-partner survey, an explanation that could not be independently confirmed. Both stocks had fallen about 7% on the prior Friday in the AI-financing selloff.
Why it matters:A flaw in the language runtime rather than in an application puts the patching burden on every server operator at once, and a leak with live attack traffic removes the usual grace period, the kind of event that pulls security budgets forward. It also sharpened a distinction the market drew all week inside the AI trade: the companies that defend AI workloads were bought while the companies that supply AI hardware were sold. CrowdStrike and Palo Alto finished as the week’s top two megacap gainers, and both extended runs that have more than doubled their shares this year (see weekly movers table in Section B), which makes this momentum continuation rather than a relief bounce.
What to watch:Reports of mass exploitation of the PHP flaws, and Fortinet’s billings after the close on Wednesday, October 28, the first read on whether the incident shows up in demand.
UNCERTAIN
6. “Capacity Is the Constraint”: Nvidia Prepays Its Suppliers, Chinese Buyers Order More Than $35 Billion of Workstation Cards and Anthropic’s Draft Filing Shows $450 Billion of Cloud Commitments
The core facts:On Monday Bloomberg reported that Nscale is in talks to sell Anthropic about $45 billion more computing power from a West Virginia campus. On Tuesday Reuters reported that ByteDance, Alibaba and Tencent have ordered more than three million of Nvidia’s export-compliant RTX PRO 5500 cards, above $35 billion at sticker price, and that Nvidia has told customers it cannot guarantee supply. The same afternoon the Wall Street Journal reported Anthropic’s draft IPO prospectus: first-half revenue of $16.3 billion, up from $1.1 billion, a net loss of $80.7 billion, about $72 billion of it non-cash, and roughly $450 billion of noncancelable cloud commitments, including $111 billion with Google Cloud, $110 billion with AWS and $31 billion with Microsoft; the draft says it sought more capacity than the hyperscalers would supply. On Wednesday Nvidia announced capacity agreements with six supply-chain partners at GTC Berlin, including a $1.1 billion advance to King Yuan Electronics, and Jensen Huang said “Capacity is the constraint.” On Thursday CNBC reported OpenAI is nearing a raise of up to $30 billion at a $1.25 trillion pre-money valuation, below earlier reports of more than $1.4 trillion.
Why it matters:Every disclosure this week said the same thing about demand: it outruns supply. That is the bull case in its strongest form, and it explains Lam Research’s capped guidance (Story #2), which was a statement about tools it cannot ship, not orders it cannot win. The same documents expose the financing chain the market sold on Thursday. About $252 billion of contracted demand at Alphabet, Amazon and Microsoft rests on one customer that lost about $8.7 billion in six months excluding financing charges, depends on two clients for a fifth of its revenue and needs public equity to keep building, while the largest private AI buyer is now raising at a lower valuation than it sought. Demand is not the question any more; the balance sheets behind it are.
What to watch:Cloud-backlog commentary from Alphabet and Microsoft on October 28 and Amazon on October 29, and the public flip of Anthropic’s registration statement, expected after the November 3 midterms.
UNCERTAIN
7. Washington Reaches for Fuel-Supply Levers Before the Midterms: A Russia Tariff Waiver, a Heating-Oil Loan, the Defense Production Act and an Emergency SPR Exchange
The core facts:An executive order released late on October 16 and reported Monday waived the Graham Act’s tariffs of up to 100% on the largest buyers of Russian crude and gas, along with a list of its sanctions provisions, with no fixed expiry; lawmakers from both parties criticised it. On Wednesday the Energy Department offered to loan up to 315,000 barrels, a third of the Northeast Home Heating Oil Reserve, with bids due October 27, as Moscow said the first Russian diesel cargo for the US would sail Thursday; the same day Putin agreed “in principle” to resume trilateral Ukraine talks after November 10. On Thursday a Presidential Determination under the Defense Production Act declared domestic petroleum production, refining and logistics essential to national defense and authorized federal purchases and financial support, naming no dollar amount or projects. On Friday the Energy Department authorized an emergency exchange of up to 400,000 barrels from the Strategic Petroleum Reserve to Phillips 66’s Lake Charles refinery.
Why it matters:Four measures in five days show where the administration sees the squeeze: in refined products, not crude. Distillate stocks are 9% below their five-year average, New England heating oil is up about 70% in a year, and the IEA says diesel prices have doubled since before the war. The volumes are small — the heating-oil loan and the Russian cargo together come to roughly a sixth of a single day’s US distillate demand — so the near-term price effect is marginal and the signal is political, two weeks before the November 3 midterms. The Defense Production Act order is the one with lasting reach: federal money for refining and pipeline capacity is a long-run margin risk for refiners earning peak-cycle profits, with Valero’s refining operating income up to $8.8 billion from $1.6 billion a year earlier.
What to watch:The heating-oil reserve bids on Tuesday, October 27; any first purchase commitments under the Defense Production Act; and Phillips 66’s results on Wednesday, October 28, after the Lake Charles disruption.
— Separating signal from noise since 2007. Apply for membership at join.recessionalert.comD. WEEK IN THE ECONOMY -> TOP
The week delivered a stagflation pulse in miniature: price signals ran hot while the rate-sensitive corner of the economy cracked. Housing broke under mortgage rates above 7%, with starts and pending sales falling sharply and builder confidence at a 14-year low, even as Friday’s flash PMI showed selling prices rising at their fastest pace since August 2022 and Michigan’s year-ahead inflation expectations climbed to 4.7%. Activity elsewhere is not the problem: jobless claims stayed below 200,000 and the PMI’s output gauge points to 5% growth, so the squeeze is narrow rather than general. Markets read the week the dovish way anyway, with the 10-year 9.6 bps lower, futures cutting December hike odds to 76% from 87% and Polymarket recession odds up just a point, a bond-market bet against the price data. Wednesday’s FOMC decision and Thursday’s September PCE, with core expected at 0.3%, will show which side the Fed takes.
POLYMARKET ODDS — WEEK-ON-WEEK SHIFT:
| Market | Last Friday | This Friday | Δ |
|---|---|---|---|
| US Recession by end-2026 | 7% | 8% | +1.0 pp |
| Another Fed hike in 2026 | n/a (new market) | 78% | n/a |
| Fed rate cuts ≥1 in 2026 | 3% | 4% | +1.0 pp |
Another Fed hike in 2026 tracks a new market this week: the earlier “Fed rate hike in 2026” market settled YES at the September 16 hike, so last Friday’s 100% is not comparable and no weekly change is shown.
BEARISH
Housing Breaks Under 7% Mortgages: Builder Confidence Hits a 14-Year Low, Starts Miss by 79,000 and Pending Sales Plunge 7.3% (NAHB, Census, NAR, MBA, Freddie Mac, Mon, Oct 19 – Thu, Oct 22)
What they’re saying:The NAHB builder index fell three points to 29 on Monday against a 32 consensus, its lowest since June 2012, with 43% of builders cutting prices. On Tuesday September housing starts fell 5.2% to a 1.221 million annual pace against 1.30 million expected, with single-family permits down 4.0%, and NAR’s pending home sales index fell 7.3% against an expected 0.5% dip, which Lawrence Yun blamed on “fast-rising mortgage rates.” On Wednesday MBA mortgage applications fell 5.3% even as the 30-year contract rate eased to 7.41%, with purchase applications 18% below a year earlier. On Thursday Freddie Mac’s 30-year rate slipped to 7.32% from 7.40%, still 1.13 points above a year ago.
The context:Four days, five releases, one message: housing is the channel through which 5% Treasury yields reach the real economy, and it is the only one breaking. The Atlanta Fed trimmed its third-quarter GDP estimate after Tuesday’s data precisely through private fixed investment, while the consumer component rose. Washington responded on Thursday with an executive order targeting mortgage and title insurance costs and a proposed Treasury rule barring investors with 350 or more homes from buying more from January 7, both aimed at costs around the loan rather than the rate itself. The market offered less relief than the headlines suggest: Real Estate rose under 1% on the week on lower yields (see sector rotation table in Section B), and the mortgage REIT ETF had hit its lowest level since April 2020 on Monday. Thursday’s 17.2 bp fall in the 10-year came after Freddie Mac’s survey window, so it is not yet in mortgage rates.
What to watch:September new home sales (expected 0.66 million) and Case-Shiller home prices on Tuesday, October 27, then the MBA survey on Wednesday, October 28, the first to capture the lower 10-year yield.
BEARISH
Price Signals Run Hot: Flash PMI Selling Prices Rise at the Fastest Pace Since August 2022 and Year-Ahead Inflation Expectations Climb to 4.7% (S&P Global, University of Michigan, Fri, Oct 23)
What they’re saying:S&P Global’s flash composite output index eased to 57.6 from 58.4, while the manufacturing PMI rose to 56.0, a 53-month high, and selling prices rose at the sharpest rate since August 2022. Chris Williamson said prices are rising “at a pace that indicates consumer price inflation is likely to rise further above the Fed’s target in the coming months,” pointing to the renewed surge in oil. The University of Michigan’s final October sentiment index came in at 48.0 against a 46.3 consensus, but current conditions fell 8.3% to 46.7, year-ahead inflation expectations rose to 4.7% from 4.6% and long-run expectations to 3.5% from 3.4%, both the highest since May. Earlier in the week the New York Fed’s services survey (Monday) showed selling-price increases at the fastest pace since 2022, and Atlanta Fed survey firms (Wednesday) reported unit cost growth rising to 2.6%.
The context:Three surveys in one week, from businesses and households, all pointed to firmer prices, and the common source is energy: Brent gained 6.3% on the week (see Energy table in Section B), and Michigan’s year-ahead expectations stood at 3.4% in February, before the Iran conflict. The bond market did not trade it. The 10-year rose only 4.3 bps on Friday, no source tied the move to the data, and the week still ended 9.6 bps lower. That leaves a gap between firming inflation signals and easing hike expectations going into a meeting with no new Fed projections.
What to watch:September PCE on Thursday, October 29 (headline expected 0.5% m/m, core 0.3%), and the Q3 Employment Cost Index on Friday, October 30 (expected 0.8%).
UNCERTAIN
A December Hike Becomes the Consensus, Then Fades in Futures: 94 of 100 Economists Expect a Hold Then a Hike, While Market Odds Ease to 76% From 87% (Reuters poll, Tue, Oct 20; Fed funds futures, Fri, Oct 23)
What they’re saying:A Reuters poll conducted October 16-20 found 94 of 100 economists expect the Fed to hold its 3.75%-4.00% range on October 28, and nearly all expect a December hike, up from fewer than half a month earlier; nearly 60% see the policy rate peaking at 4.00%-4.25%, and PCE inflation is not expected back at 2% until at least 2028. Mizuho’s Alex Pelle said, “They’ll go 25 in December, but the risk is greater they end up going 50 than they don’t go at all.” By Friday afternoon fed funds futures priced a 92% chance of a hold on Wednesday and a 76.3% chance of at least one more hike by the December 9 meeting, down from 86.5% a week earlier; Polymarket’s new “Another Fed hike in 2026” contract stood at 78%.
The context:Forecasters and traders moved in opposite directions within the same week. Economists hardened toward a December hike on the inflation outlook, while futures softened after Thursday’s haven rally in Treasuries, which had nothing to do with the data. The front end moved less than the long end, the 2-year down 2.9 bps against 9.6 bps for the 10-year (see Vol & Treasuries table in Section B), so the market has trimmed rather than abandoned its hike pricing. Morgan Stanley’s Michael Gapen framed the asymmetry: “The risks are in the direction of a Fed that ultimately needs to hike rates more than we expect.” With officials in their blackout, Wednesday’s statement and press conference are the first chance for the Fed to say which camp it is in.
What to watch:The FOMC decision at 2:00 PM ET on Wednesday, October 28, and the 2:30 PM press conference language on December.
BULLISH
Growth Holds Up Outside Housing: GDPNow Tracks 3.5%, the Leading Index Holds Flat and the Conference Board Raises Its 2026 Forecast to 2.2% (Atlanta Fed, Tue, Oct 20; Conference Board, Thu, Oct 22)
What they’re saying:The Atlanta Fed’s GDPNow model trimmed its third-quarter estimate to 3.5% from 3.6% on Tuesday, as modest gains in consumer spending and inventories were offset by weaker private fixed investment, net exports and government spending. On Thursday the Conference Board’s Leading Economic Index was unchanged at 99.6, slightly better than the 0.1% decline expected, and the Board raised its real GDP forecast to 2.2% for 2026 and 2.0% for 2027, from 1.9% and 1.8%. The Kansas City Fed’s manufacturing index slowed to 16 from 20 but stayed in expansion, and Friday’s flash PMI output readings were, in S&P Global’s words, consistent with GDP growing at a 5% annualized rate. The weak outlier was the New York Fed’s services activity index, which dropped 12 points to −20.7.
The context:Away from housing the economy is running warm, which is exactly why housing’s collapse buys no rate relief. The Conference Board described the leading index as “becoming less dependent on consumer spending and more dependent on business investment,” with falling consumer expectations the largest drag, a split that fits a week of strong business surveys and weak household ones. Physical activity agreed: Union Pacific reported carloads up 6% on Thursday. Polymarket’s recession odds rose only a point to 8% (see Polymarket table above).
What to watch:The Q3 GDP advance estimate on Thursday, October 29 (expected 3.0%, against the PMI’s 4% signal for the quarter), with the Dallas Fed index on Monday and durable goods orders on Tuesday as earlier reads.
UNCERTAIN
Layoffs Stay Low as Hiring Slows: Jobless Claims Fall to 194,000 Against 200,000 Expected While ADP’s Weekly Pace Drops to 18,500 (Labor Department, Thu, Oct 22; ADP, Tue, Oct 20)
What they’re saying:Initial jobless claims fell 6,000 to 194,000 in the week ending October 17, below the 200,000 consensus, and the four-week average eased to 197,750; continuing claims rose 25,000 to 1.728 million, with the insured unemployment rate steady at 1.1%. ADP’s preliminary weekly estimate showed private employers adding an average of 18,500 jobs a week in the four weeks to October 3, down from 26,000. Friday’s flash PMI, by contrast, showed employment rising at the second-fastest pace in over four years.
The context:The labor picture is low-fire and slower-hire: layoffs are near cycle lows, with unadjusted claims well below a year ago, while ADP points to softer hiring and the PMI to stronger hiring, so the hiring signal is contested. For the Fed that leaves no labor-market slack to argue against tightening. The claims beat also proved irrelevant to markets on the day: the 10-year fell 17.2 bps on Thursday as haven buying swamped the data (see Vol & Treasuries table in Section B).
What to watch:Jobless claims on Thursday, October 29, alongside GDP and PCE, and the Q3 Employment Cost Index on Friday, October 30, for whether firm hiring is reaching wages.
— Know the probability before the market prices in the risk. Apply for membership at join.recessionalert.comE. WEEK IN EARNINGS -> TOP
TOP EARNINGS OF THE WEEK
UNCERTAIN
1. Meta Platforms (META): −6.98% on Results Day | Record Revenue and a Beat, but a Higher Spending Floor and a Non-Voting Share Class Turn the Quarter Into a Funding Question
The Numbers:Released Wednesday, October 21, after the close. Revenue a record $64.60 billion vs. $63.34 billion expected, up from $51.2 billion a year earlier. GAAP EPS $3.83 including a legal charge tied to its teen mental-health settlement; $7.40 excluding it vs. $6.54 expected. Fourth-quarter revenue guidance midpoint above the Street, per CNBC. 2026 capex range narrowed to $135-$145 billion from $130-$145 billion. A non-voting Class C share, one for each Class A share, to begin trading in late January 2027. Shares closed Thursday at $648.85.
The Problem/Win:Win: the core business accelerated, with revenue up about 26% year over year, Instagram time spent per user at an all-time high, Threads time spent up 20%, and Zuckerberg guiding Reality Labs’ operating loss down to about $15 billion next year. Problem: the two capital decisions. Raising the bottom of the capex range removes the possibility of a spending cut, and a new non-voting share class lets Meta raise equity for the build-out without diluting Zuckerberg’s control, which investors read as a signal of issuance ahead. A 2% after-hours gain reversed in Thursday’s session.
The Ripple:Communication Services was the week’s worst sector, with Meta joined by Netflix and Alphabet among the ten largest megacap decliners. The Street did not turn on the stock: Mizuho raised its target to $950 from $750, Susquehanna to $850 from $650 and BofA to $845 from $810, with no rating changes, while TD Cowen trimmed to $850 from $865.
What It Means:Advertising is funding AI with room to spare, so the problem is not the income statement but the funding mix: with the share class in place, Meta now trades on capex discipline and the cost of capital rather than on revenue beats.
What to watch:Record and distribution dates for the Class C shares, and Meta’s first 2027 capex framework.
UNCERTAIN
2. Lam Research (LRCX): −11.76% on Results Day | A Record Quarter and an Above-Consensus Guide, Capped by Supply, Fail to Clear the Bar
The Numbers:Released Wednesday, October 21, after the close. EPS $2.20 vs. $2.18 expected; revenue a record $8.22 billion vs. $8.14 billion, with a non-GAAP operating margin of 40.2%. December-quarter guidance: revenue $8.60 billion plus or minus $400 million vs. $8.53 billion expected, and adjusted EPS $2.33 plus or minus $0.15 vs. $2.31. Shares closed Thursday at $230.15.
The Problem/Win:Win: record revenue at a 40% operating margin. Problem: a beat of two cents and a guide less than 1% above consensus for a stock AP noted had surged 52.4% this year, and management said supply-chain constraints held back what could have been a stronger December quarter, which caps the near-term upside however strong orders are.
The Ripple:Applied Materials fell 8.16% on Thursday with no company-specific news, leading the chip-equipment group lower, and both names finished among the week’s five worst megacaps. Brokers cut targets but kept positive ratings: Needham to $290 from $390, Morgan Stanley to $339 from $385 and Mizuho to $360 from $365.
What It Means:Wafer-fab equipment demand is intact but priced for upside, so an in-line guide is now treated as a miss across the group; the binding variable is how fast suppliers can ship, not how much customers want.
What to watch:KLA’s results after the close on Wednesday, October 28, against its $4.0 billion revenue guidance.
BULLISH
3. Procter & Gamble (PG): +5.58% on Results Day | Volume-Led Organic Growth Across Every Category Gives the Defensive Rotation Its Earnings Anchor
The Numbers:Released Thursday, October 22, before the open. Core EPS $2.00 vs. $1.88 expected; diluted EPS $1.97. Net sales $23.3 billion, up 4%, vs. $22.80 billion. Organic sales +4.0% (volume +2.4 points, pricing +0.4, mix +1.1), against +2% a year earlier. Full-year organic sales and EPS guidance unchanged. Shares closed at $165.59, the session’s top megacap gainer.
The Problem/Win:Win: growth led by volume in all 10 categories and all six regions, the quality investors had doubted after a period of price-led staples growth. Problem: management warned that cost headwinds will increase over the next few quarters, and CEO Shailesh Jejurikar said he expects “geopolitical and economic challenges” to continue, with oil above $100 feeding input costs.
The Ripple:Consumer Defensive led all sectors with a 3.13% gain on Thursday, and AP credited P&G with limiting the S&P 500’s loss on the day of the AI rout. The support did not last: on Friday P&G fell 2.76% and Consumer Defensive finished last of 11 sectors, leaving it up only 0.40% on the week.
What It Means:Staples are being bought for growth, not just safety, which makes the defensive rotation more durable than a simple flight from tech; Friday’s give-back shows how much of the sector’s move is still positioning around the AI trade.
What to watch:Coca-Cola’s results before the open on Tuesday, October 27, for whether volume-led growth extends across staples.
WEEK AHEAD PREVIEW:
Q3 2026 earnings season reaches its heaviest stretch, with 38 companies above $100 billion reporting over the next five sessions, including Alphabet and Microsoft on the afternoon of the Fed’s October 28 decision, Amazon on October 29, and ExxonMobil and Chevron on October 30.
Verizon Communications (VZ) — BMO, Monday, October 26 — Consensus EPS $1.27. Key focus: postpaid phone net additions and churn, after Friday’s telecom selloff on a report that SpaceX is exploring a US wireless carrier program.
Welltower (WELL) — AMC, Monday, October 26 — Consensus EPS $0.64. Key focus: senior-housing occupancy and same-store NOI growth against a full-year normalised FFO midpoint of $6.40, raised in July, with the 10-year yield just below 5%.
Visa (V) — AMC, Tuesday, October 27 — Consensus EPS $3.44. Key focus: cross-border volume growth, which ran at 13% in the fiscal third quarter, and fiscal 2027 net revenue guidance, after American Express’s 8% billed-business growth.
Coca-Cola (KO) — BMO, Tuesday, October 27 — Consensus EPS $0.88; -2.76% today. Key focus: organic revenue growth and price/mix against full-year guidance of about 5% organic growth, as Consumer Defensive finished the week’s last session as the weakest sector.
Boeing (BA) — BMO, Tuesday, October 27 — Consensus EPS -$0.25. Key focus: a first 737-10 delivery date after the FAA certification, 737 production rates and cash burn.
S&P Global (SPGI) — BMO, Tuesday, October 27 — Consensus EPS $4.43. Key focus: ratings revenue as debt issuance holds up, in its first quarter excluding the spun-off Mobility business.
Corning (GLW) — BMO, Tuesday, October 27 — Consensus EPS $0.88. Key focus: optical communications growth from AI data centers and progress toward its Springboard sales targets.
HCA Healthcare (HCA) — BMO, Tuesday, October 27 — Consensus EPS $6.65; market cap $101.6 billion, just above the threshold. Key focus: same-facility admissions, which rose 2.5% in the second quarter, the 2026 net income outlook of $6.3 billion-$6.7 billion, cut in July, and any comment on Friday’s ACA subsidy-verification proposal (Story 9).
Seagate Technology (STX) — AMC, Tuesday, October 27 — Consensus EPS $7.42. Key focus: nearline supply allocated into 2028 and the HAMR ramp, after Western Digital’s beat and $5.1 billion guide (Story 12).
Alphabet (GOOGL) — AMC, Wednesday, October 28 — Consensus EPS $3.03. Key focus: Google Cloud growth after 82% in the second quarter, 2026 capex guidance of $195 billion-$205 billion, and the OpenAI distribution deal.
Microsoft (MSFT) — AMC, Wednesday, October 28 — Consensus EPS $4.71. Key focus: Azure growth against guidance of about 45% at constant currency, and fiscal first-quarter capex of about $50 billion, as investors question AI spending.
GE Vernova (GEV) — BMO, Wednesday, October 28 — Consensus EPS $3.99. Key focus: gas-turbine orders and slot reservations against a target of at least 125 GW by year-end, the backlog, $176 billion in the second quarter, and any comment on the wind-turbine Section 232 proclamation.
KLA (KLAC) — AMC, Wednesday, October 28 — Consensus EPS $1.18. Key focus: results against guidance of $4.0 billion in revenue, and wafer-fab equipment demand after Lam Research’s 11.76% slide on Thursday.
Amphenol (APH) — BMO, Wednesday, October 28 — Consensus EPS $0.73. Key focus: IT datacom sales driven by AI data centers and record orders, and the CommScope integration.
ServiceNow (NOW) — AMC, Wednesday, October 28 — Consensus EPS $1.02. Key focus: subscription revenue against guidance of about 20.5% growth, and AI monetisation through Now Assist.
T-Mobile US (TMUS) — AMC, Wednesday, October 28 — Consensus EPS $2.89. Key focus: postpaid account additions, now its headline metric, and its response to SpaceX’s push into US wireless service.
UBS Group (UBS) — BMO, Wednesday, October 28 — Consensus EPS $0.91 (no ADR label; NYSE-listed shares). Key focus: the pace of its $3 billion buyback under proposed Swiss capital reforms, and wealth-management net new assets.
Fortinet (FTNT) — AMC, Wednesday, October 28 — Consensus EPS $0.86. Key focus: billings against guidance of $2.25 billion-$2.35 billion and the firewall refresh cycle, after CrowdStrike and Palo Alto Networks rallied more than 7% on Friday (Story 6).
Automatic Data Processing (ADP) — BMO, Wednesday, October 28 — Consensus EPS $2.77. Key focus: US pays per control, which grew just 1% last quarter, as a read on payroll growth, and interest income on client funds.
Phillips 66 (PSX) — BMO, Wednesday, October 28 — Consensus EPS $11.73. Key focus: refining margins and utilization, including the supply disruption at Lake Charles that drew an emergency SPR exchange on Friday (Story 1).
Amazon (AMZN) — AMC, Thursday, October 29 — Consensus EPS $1.96. Key focus: AWS growth after 36.8% in the second quarter, its fastest in 18 quarters, and 2026 capex of about $220 billion; Q3 guidance was $197 billion-$202 billion in net sales.
Eli Lilly (LLY) — BMO, Thursday, October 29 — Consensus EPS $5.70; -2.54% today. Key focus: Mounjaro and Zepbound volumes against 2026 revenue guidance of $85 billion-$87 billion, raised in July.
Mastercard (MA) — BMO, Thursday, October 29 — Consensus EPS $5.17. Key focus: net revenue growth after 12% underlying growth in the second quarter, with full-year guidance held, and cross-border volumes.
Intel (INTC) — AMC, Thursday, October 29 — Consensus EPS $0.40. Key focus: revenue against guidance of $15.8 billion-$16.8 billion and the rising equipment and capacity spending its CFO flagged, after this week’s chip selloff.
Merck (MRK) — BMO, Thursday, October 29 — Consensus EPS $2.09. Key focus: Keytruda sales and the commercial outlook for intismeran after the INTerpath-001 melanoma data.
Caterpillar (CAT) — BMO, Thursday, October 29 — Consensus EPS $7.04. Key focus: power-generation sales to data centers, which grew 72% in the second quarter, a record $72.1 billion backlog, and 2026 sales growth guidance of mid to high teens.
Linde (LIN) — BMO, Thursday, October 29 — Consensus EPS $4.52. Key focus: industrial gas volumes and pricing as a read on global manufacturing, and energy cost pass-through with European gas at its highest close since at least April 15.
TotalEnergies (TTE) — BMO, Thursday, October 29 — Consensus EPS $3.82 (no ADR label). Key focus: refining and LNG earnings with Brent above $116 and Gulf supply disrupted.
Gilead Sciences (GILD) — AMC, Thursday, October 29 — Consensus EPS $2.18. Key focus: HIV franchise growth and how guidance absorbs the $0.79-$0.83 fourth-quarter EPS charge from the PepStar acquisition announced on October 22.
Sandisk (SNDK) — AMC, Thursday, October 29 — Consensus EPS $46.20. Key focus: results against its guidance of $44-$46 in EPS and $10.3 billion-$10.8 billion in revenue, and NAND pricing.
Bristol Myers Squibb (BMY) — BMO, Thursday, October 29 — Consensus EPS $1.10. Key focus: Eliquis sales, which rose 22% to $4.48 billion in the second quarter, against non-GAAP EPS guidance of $6.75-$7.00, and the zola-cel restart timeline after Friday’s disclosure of a patient death (Story 8).
Altria (MO) — BMO, Thursday, October 29 — Consensus EPS $1.51. Key focus: smokeable volumes and pricing against adjusted EPS guidance of $5.61-$5.72, narrowed in July.
Stryker (SYK) — AMC, Thursday, October 29 — Consensus EPS $3.55. Key focus: organic growth against 2026 guidance of 8.3%-9.3%, which analysts said requires a significant second-half step-up.
Starbucks (SBUX) — AMC, Thursday, October 29 — Consensus EPS $0.72. Key focus: US comparable sales against guidance of 6.5% or greater for the quarter, after 7.9% in the third quarter.
ExxonMobil (XOM) — BMO, Friday, October 30 — Consensus EPS $4.10; +2.79% today. Key focus: the roughly $4.5 billion refining-margin boost to Energy Products that the company pre-flagged against a $1.3 billion hit from lower liquids prices, and $2.5 billion of negative timing effects.
AbbVie (ABBV) — BMO, Friday, October 30 — Consensus EPS $3.74. Key focus: Skyrizi and Rinvoq, which AbbVie expects to exceed $31 billion in combined 2026 sales, after the FDA approved a subcutaneous Skyrizi induction regimen in Crohn’s disease on Friday, per the company.
Chevron (CVX) — BMO, Friday, October 30 — Consensus EPS $4.86; +2.88% today. Key focus: refining margins, which UBS said lifted its third-quarter EPS estimate to $4.93, and cash flow with crude above $100.
AstraZeneca (AZN) — BMO, Friday, October 30 — Consensus EPS $2.59 (no ADR label; NYSE-listed ordinary shares). Key focus: whether it reaffirms 2026 guidance of mid-to-high single-digit revenue growth and low double-digit core EPS growth, days after the ESMO oncology congress.
Excluded as ADRs: SK Hynix, HSBC and Novartis (October 27); Equinor and GSK (October 28); Shell, Anheuser-Busch InBev and BBVA (October 29); BP (October 30). Just below the $100 billion threshold: Waste Management at $95.7 billion (October 27), Trane Technologies at $97.9 billion (October 29) and General Dynamics at $94.5 billion (October 30). The Fed’s decision on October 28 lands in the middle of the season’s peak, followed by the Q3 GDP advance estimate and September PCE on October 29.
— US market commentary trusted by family offices and institutions. Apply for membership at join.recessionalert.comF. NEXT WEEK SETUP -> TOP
UPCOMING RELEASES:
| Date | Event | Why It Matters |
|---|---|---|
| Mon Oct 26 | Chicago Fed National Activity Index (prior -0.04) | A broad monthly activity gauge; a positive reading would confirm that growth outside housing held up in September, as this week’s business surveys implied. |
| Mon Oct 26 | Dallas Fed Manufacturing Index (prior 9.8) | Follows the Kansas City Fed’s slowdown to 16; a second regional slip would show factory momentum fading even as the national manufacturing PMI hit a 53-month high. |
| Tue Oct 27 | Building Permits MoM Final (expected -0.2%, prior -2.1%) | The final revision to September permits; single-family authorizations fell 4.0% in the first read, and a downward revision would deepen the builder pullback. |
| Tue Oct 27 | ADP Employment Change Weekly (prior 18.5K) | The last weekly hiring pulse before the Fed decides; another step down from 18,500 would sharpen the split with the flash PMI’s strong employment reading. |
| Tue Oct 27 | Durable Goods Orders Ex Transp MoM (prior 0.3%) | The core equipment-demand read behind GDPNow’s investment line, the component that pulled its third-quarter estimate down this week. |
| Tue Oct 27 | Durable Goods Orders MoM (expected 0.6%, prior 0%) | Headline orders include aircraft, so Boeing’s results the same morning, its first since the 737-10 certification, make transport the swing factor. |
| Tue Oct 27 | S&P/Case-Shiller Home Price YoY (prior 2.5%) | Prices have held while volumes collapsed; a slowdown from 2.5% would show the price cuts 43% of builders reported spreading into resale values. |
| Tue Oct 27 | CB Consumer Confidence (expected 80.5, prior 81.9) | Consumer expectations were the biggest drag on the leading index; a second household survey after Michigan’s drop in current conditions tests how far oil is denting confidence. |
| Tue Oct 27 | New Home Sales (expected 0.66M, prior 0.684M) | The first new-home demand read since builder confidence hit a 14-year low; a miss would complete a full set of weak housing data. |
| Tue Oct 27 | New Home Sales MoM (prior 6.4%) | August’s 6.4% jump came before mortgage rates passed 7.4%; giving it back would confirm that rates, not supply, are setting the pace. |
| Tue Oct 27 | Atlanta Fed GDPNow (expected 3.5%, prior 3.5%) | Updates the third-quarter tracker on durables and housing two days before the official estimate, against S&P Global’s 4% signal for the quarter. |
| Tue Oct 27 | API Crude Oil Stock Change (prior -4.93M) | An early read on whether the run of large US crude draws continues while Brent carries a Gulf premium above $116. |
| Wed Oct 28 | MBA 30-Year Mortgage Rate (prior 7.41%) | The first mortgage survey to capture Thursday’s 17.2 bp fall in the 10-year; a drop toward 7.25% would test whether housing demand responds to lower rates. |
| Wed Oct 28 | Goods Trade Balance Adv (prior -$132.1B) | Net exports were among the components GDPNow marked down this week; the advance goods gap feeds straight into Thursday’s GDP estimate. |
| Wed Oct 28 | Retail Inventories Ex Autos MoM Adv (prior 0%) | Inventory building added to GDPNow this week; a flat or falling figure would trim the third-quarter estimate at the margin. |
| Wed Oct 28 | Wholesale Inventories MoM Adv (prior 0.5%) | A second inventory input for Thursday’s GDP print; continued accumulation would flatter third-quarter growth at the expense of the fourth. |
| Wed Oct 28 | EIA Crude Oil Stocks Change (prior -3.061M) | Last week’s draw nearly quadrupled forecasts; another large one would add physical tightness to a premium that so far rests on Gulf risk. |
| Wed Oct 28 | EIA Gasoline Stocks Change (prior -2.952M) | Gasoline stocks already sit 5% below their five-year average; a further draw days before the midterms raises the odds of more product-market intervention. |
| Wed Oct 28 | Atlanta Fed GDPNow | A second update in two days folds in the trade and inventory data on the morning of the Fed decision. |
| Wed Oct 28 | Fed Interest Rate Decision 2:00 PM ET (expected 4.0%, prior 4%) | A hold is priced at 92%; the statement’s December language decides whether futures’ drop in hike odds to 76% from 87% survives the afternoon. |
| Wed Oct 28 | Fed Press Conference 2:30 PM ET | The first Fed voice after the pre-meeting blackout, landing with crude above $116 and Alphabet and Microsoft reporting hours later. |
| Thu Oct 29 | Core PCE Price Index MoM (expected 0.3%, prior 0.2%) | The Fed’s preferred gauge; a 0.3% print after this week’s hot survey price signals would undercut the bond market’s dovish turn. |
| Thu Oct 29 | GDP Growth Rate QoQ Adv Q3 (expected 3%, prior 2.2%) | Consensus sits below GDPNow’s 3.5% and S&P Global’s 4% signal; an upside surprise would cement the view that housing is a pocket of weakness, not the economy. |
| Thu Oct 29 | GDP Price Index QoQ Adv Q3 (expected 3.5%, prior 6.1%) | The quarter’s broad inflation measure; a near-halving from 6.1% would be the dovish counterweight to the flash PMI’s selling-price surge. |
| Thu Oct 29 | Initial Jobless Claims (prior 194K) | Claims have held below 200,000; another low print on the day of GDP and PCE leaves the Fed no labor-slack argument against tightening. |
| Thu Oct 29 | PCE Price Index MoM (expected 0.5%, prior 0.3%) | The headline is expected to jump on energy; 0.5% would be the first official consumer-price data to carry the oil spike. |
| Thu Oct 29 | PCE Price Index YoY (prior 3.4%) | Economists polled by Reuters see no return to 2% before 2028; a rise from 3.4% would harden the December hike case. |
| Thu Oct 29 | Personal Income MoM (expected 0.3%, prior 0.2%) | Measures how much purchasing power households have against the energy shock that Michigan respondents said dominates their view of the economy. |
| Thu Oct 29 | Personal Spending MoM (expected 0.3%, prior 0.9%) | A sharp slowdown from August’s 0.9% would be the first sign that weaker household sentiment is reaching actual consumption. |
| Thu Oct 29 | Atlanta Fed GDPNow Q4 | The first fourth-quarter estimate sets the growth baseline the Fed carries toward its December 9 meeting. |
| Fri Oct 30 | Employment Cost – Benefits QoQ Q3 (prior 1%) | Benefit costs ran faster than wages last quarter; another 1% gain would add to the services-cost pressure the flash PMI flagged. |
| Fri Oct 30 | Employment Cost – Wages QoQ Q3 (prior 0.9%) | Wages are the link between firm hiring and sticky services inflation; holding near 0.9% would keep the December-hike camp’s case intact. |
| Fri Oct 30 | Employment Cost Index QoQ Q3 (expected 0.8%, prior 0.9%) | The broadest quarterly labor-cost gauge; an in-line 0.8% would show wage pressure easing slightly even as layoffs stay near cycle lows. |
| Fri Oct 30 | Chicago PMI (prior 58.8) | A regional check on whether the factory strength in the flash PMI carried through to the end of the month. |
| Fri Oct 30 | Fed Musalem Speech 12:30 PM ET | One of the first Fed voices after Wednesday’s decision, and an early read on how policymakers frame the December meeting. |
WHAT TO WATCH NEXT WEEK:
1. Will Alphabet, Microsoft and Amazon calm the AI-financing scare or deepen it? Meta’s higher spending floor triggered Thursday’s rout in chips and AI power; when Alphabet and Microsoft report after Wednesday’s close and Amazon on Thursday, investors need capex growth matched by cloud backlog, not just bigger budgets.
2. Can the Fed hold on Wednesday without reviving the December hike the bond market just priced down? Futures cut those odds to 76% while survey price gauges and household inflation expectations firmed; Thursday’s core PCE, expected at 0.3%, is the first hard data to settle the argument.
3. Does Brent’s premium survive a weekend of strike threats, and does it reach earnings? A third straight weekly gain left Brent at $116.62 with Washington talking about a long war; ExxonMobil and Chevron report on Friday, October 30, the first test of how much of the price is reaching producers’ profits.
4. Will the 10-year’s break below 5% reach housing in time? Every housing release this week weakened under mortgage rates above 7%; Tuesday’s new home sales and Wednesday’s MBA survey, the first to capture Thursday’s bond rally, show whether relief arrives before the Fed speaks.
— US market commentary trusted by family offices and institutions. Apply for membership at join.recessionalert.comG. CHART OF THE WEEK -> TOP
WHY THIS CHARTFriday’s chart won because it is the one candidate that ties the week’s dominant story to the credit market: Thursday’s AI rout began with Meta’s spending plans and ended with a record price on insuring its debt, and this chart shows the balance-sheet shift that explains why lenders, not just shareholders, now have a vote on the build-out. The other four — mortgage spreads, Chinese import prices, the 2-year yield’s term premium and global factory surveys — each map to the week’s secondary rates-and-growth thread rather than to the AI-financing question that moved the Nasdaq 100.
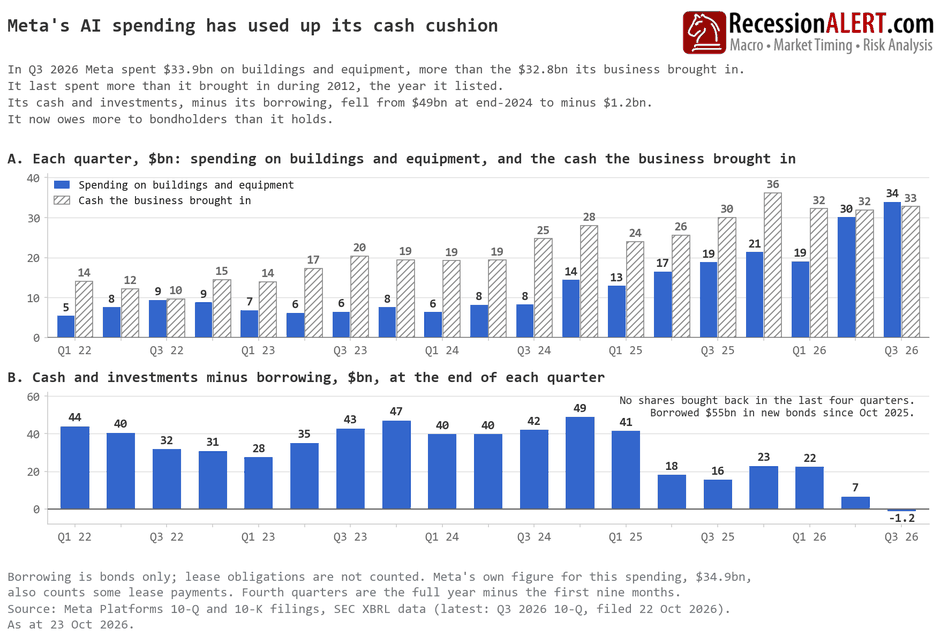
ORIGINAL CHART ANALYSIS — FROM FRIDAY’S MIBFor two years Meta handed its spare cash back to shareholders; now it owes bondholders more than it holds in cash and investments. At end-2024 its cash and investments exceeded its bonds by $49bn; by September they fell $1.2bn short, the first time as a public company Meta has crossed that line — before counting a single lease. Nothing forced it. In the 2022 advertising slump, spending reached 97% of cash flow because both moved against Meta: spending rose while cash from the business fell by almost a third. This time that cash rose 9% on the year while spending on buildings and equipment rose 80%, to $33.9bn on the chart’s measure. A squeeze ends when advertisers come back; a decision ends only when management changes its mind. Meanwhile buybacks stopped — $62.3bn in the eight quarters to Q3 2025, none in the four since — and $54.8bn of new bonds covered what Meta’s own cash did not; the interest bill has roughly quadrupled in a year. Its own guidance says the climb continues: fourth-quarter spending of $49-59bn on Meta’s broader measure, against a $34.9bn record. Reuters reported on 22 October that the cost of insuring Meta’s debt against default had touched an all-time high, as investors grappled with concerns about its AI spending. Lenders now have a say over whatever the business’s own cash does not cover. The company that used to buy back its own shares is now selling its own IOUs. What it means: Meta is no longer buying its own shares, so its stock price will rest more heavily on whether the AI spending pays off. Many households own Meta through index funds and retirement plans, so that bet now sits inside ordinary savings. For the economy, the data-centre build-out continues, but more of it now rests on borrowed money. That leaves it more exposed to the credit market than it was a year ago. Watch the fourth quarter: a return to buybacks, or cash and investments climbing back above bonds, would say the shift is reversing.
MIB Weekly Digest Ver. 2.10
For professional investors only. Not investment advice.
© 2026 RecessionALERT.com

Comments are closed.