
MIB WEEKLY DIGEST
Week of Oct 26–30, 2026
Intel’s 28.58% one-day collapse and Alphabet’s worst session since listing ended a week that began with an AI rally, leaving the Nasdaq 100 down 1.98% and the S&P 500 down 0.57% while the Russell 2000 gained 1.29%. Meta’s $37.5 billion equity sale, Microsoft’s $25 billion-plus bond deal and Amazon’s $42.4 billion free-cash outflow made AI funding the market’s central question. The Fed held in a 10-2 vote with two dissents for a hike, yet the 10-year yield fell 7.1 bps. Silver slid 8.97% and gold broke below $4,000 despite Hormuz attacks that left Brent at $112.34.
TABLE OF CONTENTS
A. WEEK AT A GLANCE
B. WEEK IN MARKETS
C. WEEK’S TOP STORIES (8)
D. WEEK IN THE ECONOMY (5)
E. WEEK IN EARNINGS (3)
F. NEXT WEEK SETUP
G. CHART OF THE WEEK
A. WEEK AT A GLANCE -> TOP
The S&P 500 lost 0.57% and the Nasdaq 100 1.98% on the week, after a three-day AI-led rally gave way to Alphabet’s and Intel’s reports, while the Russell 2000 rose 1.29%. The dominant driver was the cost of the AI build-out, as equity sales, bond deals and negative free cash flow turned spending into a financing question. A split Fed, crude above $100 and falling Treasury yields left investors favouring defensives and bonds over metals going into the midterms.
• Intel −28.58% on Friday on a guide that halves expected EPS, taking the Nasdaq 100 down 3.46% that day and to 9.1% below its October 6 close.
• Alphabet −12.64% on Thursday, its worst session since listing, on $51.4 billion of capex and negative free cash flow of $9.1 billion; Microsoft fell just 0.16% with Azure up 48%.
• Fed held at 3.75%-4.00% in a 10-2 vote, with Cook and Hammack dissenting for a hike, yet the 2-year yield fell 9.6 bps on the week and Polymarket’s hike odds dropped to 70% from 78%.
• Q3 GDP 3.4% and September PCE 3.6%: growth beat and inflation matched forecasts, while real disposable income fell 0.3%.
• Silver −8.97%, gold −3.11% to $3,884.97, with platinum also at its lowest close since at least April 15, despite lower yields and a stock selloff.
• Eli Lilly +11.31% and Healthcare +3.34% led the week on a 39% revenue jump and a $5.5 billion guidance raise, while Hormuz attacks doubled in October and Dutch TTF gained 10.30%.
1. AI Financing Became the Trade — Meta’s equity sale, Microsoft’s bonds, Oracle’s funding cap and Amazon’s cash outflow turned spending into a question of who pays, and the market now separates spenders by visible cash returns rather than selling them together.
2. A Falling Headline Over a Broader Market — The Nasdaq 100’s loss sat beside gains in small caps, transports, the NYSE Composite and eight of 11 sectors, which makes this a rotation away from capex-heavy leaders so far rather than a retreat from risk.
3. Hawks Talked, Bonds Rallied — Two dissents and three presidents arguing for more hikes met a lower 2-year yield and lower hike odds, as weak real incomes and cooler quarterly prices gave the market a reason to doubt the path.
4. A War Shock Without a Flight to Safety — Doubling Hormuz attacks lifted European gas to new highs while gold, silver and platinum fell and US gas slid, showing the conflict being priced through energy costs and rates rather than through traditional havens.
 — Leading economic indicators. Accurate market forecasts. Apply for membership at join.recessionalert.com
B. WEEK IN MARKETS -> TOP
The week turned on who pays for artificial intelligence. Anthropic’s IPO filing, SK Hynix’s sold-out memory outlook and Oracle’s funding cap carried stocks to Wednesday’s high, before Alphabet’s negative free cash flow on Thursday and Intel’s guidance on Friday took all of it back. The losses were unusually concentrated: four of every five S&P 500 stocks rose on Alphabet’s record drop, and small caps, transports and the NYSE Composite all finished the week higher while the Nasdaq 100 fell. The most telling divergence sat in the havens. A Fed that drew two dissents for a hike, and speakers calling for more, could not stop Treasury yields falling, yet gold, silver and platinum fell with them to their lowest closes since at least April 15. With Hormuz attacks doubling in October, the market goes into the midterms holding Treasuries and defensives rather than metals.
FRIDAY CLOSE & WEEK-ON-WEEK CHANGE — Fri, Oct 30, 2026:
MAJOR INDICES
The week closed with a Dow Theory split in the transports’ favour of 2.28 points, a gap that survived Wednesday’s freight-earnings reversal and that Caterpillar’s $65.99-a-share Thursday drop then widened. The larger pattern was by size: the Nasdaq 100 surrendered three sessions of gains in two days, while the Russell 2000 and NYSE Composite stayed above last Friday’s close even after Friday’s broad decline. Selling reached beyond the biggest names only on the last day of the week.
| Index | Fri Close | WoW Change | WoW % | Why It Moved (Week) |
|---|---|---|---|---|
| S&P 500 | 7,580.07 | −43.61 | −0.57% | Three straight gains on the AI-hardware bid took it to 7,743.98 by Wednesday; Alphabet’s and Intel’s reports then erased them, with Friday’s 1.82% fall doing most of the damage. |
| Dow Jones | 51,770.31 | −444.85 | −0.85% | Boeing’s 10.69% post-earnings slide capped Tuesday and Caterpillar’s 9.25% earnings drop hit the price-weighted average on Thursday, before Friday’s 572-point decline. |
| DJ Transportation | 20,329.33 | +287.42 | +1.43% | Rose in four of five sessions; Wednesday’s 2.46% fall on the Landstar and C.H. Robinson reports was the only break, and Friday’s 0.47% gain came against a falling Dow. |
| Nasdaq 100 | 28,384.85 | −572.68 | −1.98% | Up to 29,813.16 by Wednesday, then down 4.8% in two sessions on Alphabet’s free-cash-flow turn and Intel’s chip rout; it closed 9.1% below its October 6 high. |
| Russell 2000 | 2,811.84 | +35.94 | +1.29% | Four straight gains took it to 2,859.22 as money moved away from mega-cap tech and Treasury yields fell; Friday’s 1.66% drop gave back part of the advance. |
| NYSE Composite | 24,293.09 | +175.82 | +0.73% | Healthcare, real estate and financials carried Thursday’s 1.05% gain while the Nasdaq 100 fell; the index’s lighter AI weighting limited Friday’s loss to 0.91%. |
VOLATILITY & TREASURIES
Hawkish votes and hawkish speeches met falling yields: the 2-year peaked Tuesday at 4.741% and then shed 15.1 bps in three sessions, across the Fed’s split hold and Friday’s calls for more hikes. The market was discounting the path, not accepting it. The VIX ended where it began after a round trip through 16.89 on Wednesday, and a flat dollar through an equity rout says this was a duration bid rather than a scramble for safety.
| Instrument | Fri Level | WoW Change | Why It Moved (Week) |
|---|---|---|---|
| VIX | 19.44 | −0.01 (−0.05%) | Fell three straight sessions to 16.89 into the Fed, barely reacted to Alphabet, then jumped 13.02% on Friday after touching 23.93 intraday. |
| 10-Year Treasury Yield | 4.923% | −7.1 bps | Held near 5% through the Fed, then fell 11.7 bps Thursday despite a 3.4% GDP print and 6.1 bps Friday during the equity selloff. |
| 2-Year Treasury Yield | 4.590% | −9.6 bps | Rose to 4.741% into the FOMC meeting, then fell on the hold and on Thursday’s in-line PCE; Friday’s hawkish speakers moved it only 1.2 bps. |
| US Dollar Index (DXY) | 101.88 | +0.06 (+0.06%) | Peaked at 102.39 on Tuesday and slid with Treasury yields for three sessions, ending almost unchanged despite the Friday rout. |
COMMODITIES
Precious metals broke down while their usual supports strengthened: yields fell Thursday and Friday, the dollar eased on both days, and equities were selling off. Copper’s near-unchanged week against silver’s much larger loss marks this as a precious-specific flush rather than an industrial-demand scare. Thursday’s record $6.3 billion Binance theft gave Bitcoin a catalyst of its own, although it had already fallen with tech that day.
| Asset | Fri Price | WoW Change | WoW % | Why It Moved (Week) |
|---|---|---|---|---|
| Gold | $3,884.97/oz | $−124.73 | −3.11% | Rose to $4,082.65 by Wednesday, then lost $197.68 in two sessions, breaking $4,000 on Friday; no confirmed catalyst, with equity-margin selling and hawkish Fed pricing the leading theories. |
| Silver | $49.130/oz | $−4.840 | −8.97% | Fell below $50 with a 6.20% drop on Friday after a 2.70% loss on Thursday; lowest close since at least April 15. |
| Copper | $6.4970/lb | $−0.0030 | −0.05% | Climbed to $6.6770 by Wednesday with the chip-led advance, then gave it all back as equities sold off; no discrete catalyst identified. |
| Platinum | $1,434.40/oz | $−121.10 | −7.79% | Fell in four of five sessions, with losses of 3.31% on Thursday and 3.94% on Friday; lowest close since at least April 15. |
| Bitcoin | $76,942 | $−4,512 | −5.54% | Tracked the tech selloff with a 3.19% fall on Thursday, then lost 2.50% on Friday after the record Binance theft. |
ENERGY
Two of these weekly changes are contract rolls rather than price moves: Brent’s loss reflects the switch to the January contract, which actually rose from Monday’s $110.46, and Henry Hub’s gain reflects the switch to December, which fell from Monday’s $3.053. The real signal is the Atlantic gap, with Dutch TTF closing at new highs on Monday, Wednesday and Friday while US gas slid after a larger storage build. Friday’s crude gain against falling stocks reads as a supply shock, not a demand signal.
| Asset | Fri Price | WoW Change | WoW % | Why It Moved (Week) |
|---|---|---|---|---|
| Crude Oil (WTI) | $102.93/bbl | $−0.21 | −0.20% | Tehran talks pulled it to $100.18 by Tuesday; Yemen fighting, post-midterm strike worries and a surprise EIA draw lifted it back, and Friday’s limpet-mine attack added to the bid. |
| Crude Oil (Brent) | $112.34/bbl | $−4.28 | −3.67% | Change spans the roll from December to January; the January contract rose $1.88 from Monday’s close on the same diplomacy-versus-attacks tape as WTI. |
| Natural Gas (Henry Hub) | $2.884/MMBtu | $+0.255 | +9.70% | Change spans the roll from November to a higher-priced December; that contract fell $0.169 from Monday’s close, led by Thursday’s 80 Bcf storage injection. |
| Natural Gas (Dutch TTF) | $33.76/MMBtu | $+3.15 | +10.30% | Finished at its highest close since at least April 15, with EU storage near 75% against a five-year average of 86%, Middle East strikes and a Norwegian field outage all cited. |
S&P 500 SECTORS — WEEKLY ROTATION
Healthcare’s lead looks like regime leadership rather than a bounce, topping the 1-week and 6-month columns with Lilly and Gilead among the week’s largest gainers, though Merck and AstraZeneca also beat, so the move was wider than one stock. Communication Services is a structural laggard, worst on every horizon, with Alphabet, Netflix and Meta all among the week’s largest decliners. Technology’s modest loss hides the sharpest swing: up 3.64% over the week to Thursday, then down 4.53% on Friday, with Intel and Dell supplying the worst of it.
| Sector | 1-Week | 1-Month | 3-Month | 6-Month | YTD | 12-Month |
|---|---|---|---|---|---|---|
| Healthcare | +3.34% | +9.71% | +11.03% | +21.58% | +15.14% | +20.93% |
| Utilities | +1.26% | +8.05% | −2.69% | −8.09% | +0.38% | −4.40% |
| Consumer Cyclical | +1.21% | +3.88% | −5.29% | −5.04% | −6.16% | −7.79% |
| Real Estate | +1.18% | +4.74% | −5.91% | −3.04% | +5.04% | +4.27% |
| Consumer Defensive | +1.02% | +11.62% | +5.80% | +4.27% | +14.06% | +16.22% |
| Energy | +0.54% | +10.57% | +14.08% | +12.31% | +49.87% | +51.45% |
| Industrials | +0.52% | −1.92% | −6.14% | −7.16% | +5.67% | +5.05% |
| Financial | +0.09% | +2.51% | −3.90% | +6.78% | +3.88% | +10.05% |
| Basic Materials | −0.29% | −2.62% | −1.65% | −6.94% | +6.47% | +15.26% |
| Technology | −1.59% | −8.56% | +1.16% | +8.66% | +19.91% | +11.56% |
| Communication Services | −7.69% | −12.25% | −15.27% | −18.73% | −12.66% | −11.40% |
TOP WEEKLY MOVERS:
Earnings set both leaderboards, but with opposite momentum behind them. Lilly and Gilead extended multi-horizon runs (Lilly up 47% over six months) inside the week’s best sector, while KLA’s gain was a bounce in a stock still down 21% on the month, and it lost 5.69% on Friday alone. Among decliners the damage was to crowded winners as much as to laggards: Intel and Dell remain up 78% and 237% this year despite falling 45% and 22% on the month. Alphabet and Caterpillar, down 27% and 30% over six months, were already trending lower before their reports.
TOP 5 WEEKLY GAINERS
| Ticker | Week | YTD | Year | Why It Moved |
|---|---|---|---|---|
| LLY | +11.31% | +31.90% | +67.86% | Third-quarter revenue rose 39% to $24.4 billion on October 29, and Lilly raised its 2026 revenue guidance to $91 billion-$92 billion; retatrutide’s head-to-head win over Ozempic a day earlier added to the bid, per CNBC and the company. |
| GILD | +9.38% | +39.06% | +44.11% | Rose 4.03% ahead of its October 29 report, then 3.06% after beating on EPS ($2.55 vs about $2.19) and revenue and raising 2026 product sales guidance to $31.0 billion-$31.3 billion, its third raise this year, as HIV sales grew 18%. |
| KLAC | +8.45% | +29.96% | +30.03% | Record $4.14 billion quarter on October 28, a December-quarter revenue guide near $4.7 billion and an expectation that wafer fab equipment spending tops $200 billion in 2027; SK Hynix’s sold-out outlook had already lifted equipment makers that day. It gave back 5.69% on Friday. |
| TSLA | +7.41% | −11.10% | −9.15% | Barclays upgraded to Overweight on October 26 with a $450 target, citing an anticipated SpaceX combination; the shares gained 5.21% that day and 4.04% on Tuesday to $407.46, a counter-trend move in a stock still down on the year. |
| ADI | +6.66% | +53.80% | +79.09% | No single catalyst — broad-sector or momentum move |
TOP 5 WEEKLY DECLINERS
| Ticker | Week | YTD | Year | Why It Moved |
|---|---|---|---|---|
| INTC | −24.38% | +78.21% | +63.75% | Fell 28.58% on Friday, its worst day since 1974 per Yahoo Finance, after fourth-quarter guidance of $15 billion-$16 billion in revenue and $0.25 in EPS missed estimates of about $17 billion and $0.43, and Intel forecast PC shipments down 12% this year and 10% in 2027. |
| GOOGL | −12.61% | −10.59% | −0.58% | Its worst session since listing on October 29 erased about $500 billion of value, after $51.4 billion of quarterly capex produced negative free cash flow of $9.1 billion and diluted EPS of $2.12 missed the $3.02 estimate. |
| CAT | −9.35% | +8.71% | +6.79% | Beat on EPS with a record $78.1 billion backlog on October 29, but about $600 million of quarterly tariff costs and a full-year margin near the bottom of its target range outweighed it; the shares fell 9.25% that day and another 3.81% on Friday. |
| SPCX | −8.66% | −10.19% | – | Slid through the week and fell 6.37% to $134.72 on Friday with the tech selloff; Motley Fool cited Intel’s guidance as a weak signal for SpaceX’s partnership with the chipmaker, alongside Bank of America’s concerns over a Tesla merger and leverage from a roughly $40 billion GPU lease. |
| DELL | −7.04% | +237.07% | +163.52% | Rose 7.47% on Tuesday’s AI-hardware rally, then fell in three straight sessions, including 10.77% on Friday after Intel warned the PC slump will run into 2027 and said its OEM partners are cutting inventory, per Benzinga and Reuters. |
— Institutional-grade intelligence for serious investors. Apply for membership at join.recessionalert.comC. WEEK’S TOP STORIES -> TOP
Three threads run through the week. The AI financing thread (#1, #2, #5) shows the debate moving from whether demand exists to who pays and who is exposed. The war-shock thread (#3, #4) shows an energy conflict being priced without a flight to safety. The Washington thread (#6, #7, #8) pairs softer tariffs with harder enforcement: government pulling back at the border while pressing harder on domestic deals and pricing.
BEARISH
1. The AI Bill Comes Due: Meta Sells $37.5 Billion of Equity, Microsoft Turns to Bonds, and Alphabet Loses About $500 Billion in a Day When Its Free Cash Flow Turns Negative
The core facts:The week opened with Anthropic’s public S-1 for a Nasdaq listing under the ticker ANT, showing first-half revenue of $16.3 billion and a net loss of nearly $81 billion, and with Meta launching an equity raise it priced on Tuesday at $37.5 billion: $25.0 billion of common at $625 and $12.5 billion of mandatory convertible preferred, with AMD committing $1 billion. SpaceX disclosed a roughly $40 billion GPU finance lease with an Apollo-managed entity. On Wednesday Oracle jumped 10.73% after capping new fundraising at $20 billion through May 2030 and targeting $30 billion of free cash flow in fiscal 2029. Thursday broke the rally: Alphabet fell 12.64%, its worst session since its 2004 listing, on $51.4 billion of capex and negative free cash flow of $9.1 billion, while Microsoft, with Azure up 48%, closed down just 0.16% and launched a bond sale of at least $25 billion, its first US high-grade deal since 2017. Amazon’s trailing free cash flow turned to a $42.4 billion outflow.
Why it matters:In five sessions the build-out moved from being paid for out of cash flow to being paid for in public markets, through common stock, convertibles, leases and investment-grade bonds. Investors responded by sorting spenders rather than selling them all: Oracle was rewarded for a funding ceiling, Microsoft was spared on visible returns, and Alphabet was punished for cash burn despite Google Cloud revenue doubling. Chip suppliers buying into a customer’s equity raise deepens the circular financing that sits under the trade. The fingerprints are in the tables: Communication Services fell 7.69% on the week, the worst sector (see the sector rotation table in Section B), with Alphabet and Meta among the top weekly decliners. Jumbo investment-grade supply also competes with Treasuries for duration buyers, and the wider risk is that more of the AI trade now depends on bond and equity markets staying open.
What to watch:Final pricing and long-end spreads on Microsoft’s bonds, an amended Anthropic S-1 with a price range, and Apple and Palantir after the close on Monday, November 2.
BEARISH
2. Chips Round-Trip in Five Sessions: SK Hynix’s Sold-Out Outlook Lifts the Group to Wednesday, Then Intel’s 28.58% Collapse Takes the Nasdaq 100 to the Brink of a Correction
The core facts:Analyst upgrades of Intel and Broadcom and AMD’s Meta deployment fed the rally on Monday and Tuesday, when Dell rose 7.47% and AMD 5.45%. On Wednesday SK Hynix reported record revenue of ₩104.62 trillion, said DRAM and HBM are effectively sold out through 2029, and added a ₩20 trillion buyback; Sandisk rose 7.66% and Micron 5.86%. Intel’s report after Thursday’s close reversed the move. It guided fourth-quarter revenue to $15 billion-$16 billion and adjusted EPS to $0.25, well short of expectations, and forecast the PC market shrinking about 12% in 2026 and 10% in 2027. On Friday Intel fell 28.58% to $65.76, AMD 10.88%, Qualcomm 11.13%, Dell 10.77%, Sandisk 13.47% despite a beat, and Nvidia 4.22%; ASML lost more than 6% and the KOSPI 3.5%. Five-year credit default swaps on Intel reached an all-time high of 124.75 bps.
Why it matters:The two reports look contradictory and are connected. The memory scarcity that made SK Hynix a record earner is raising device prices, and Intel says that is helping shrink its PC market. So the same AI demand is enriching one part of the chip chain and squeezing another, which leaves the sector harder to trade as a single theme. Friday’s selling was indiscriminate across that divide. The Nasdaq 100 closed the week 9.1% below its October 6 close, with a 10% decline sitting near 28,102 (see the Major Indices table in Section B), while KLA and Analog Devices still ended among the top weekly gainers. The weekly movers table shows the split: equipment and analog names up, PC-exposed names down.
What to watch:AMD and Arista after the close on Tuesday, November 3, for whether PC weakness is Intel’s problem or the market’s, and a Nasdaq 100 close below about 28,102.
BEARISH
3. Hormuz Saga: Tehran Talks Pull WTI to the Edge of $100, Then Strike Planning, Mines and a Doubling of October Attacks Bring It Back Above $102
The core facts:Monday opened with Saudi, Pakistani and Turkish envoys in Tehran, and WTI fell for two sessions to $100.18 despite unconfirmed Houthi claims of strikes on the East-West pipeline and the Ras Tanura refinery. Wednesday turned on Yemen fighting and reports that the US told Gulf states to prepare for “a short, intense military campaign” after the midterms. On Thursday the Wall Street Journal reported CENTCOM’s commander had briefed President Trump on Iran options, and Europe announced a 42 million-barrel stock release. On Friday UK Maritime Trade Operations reported explosive devices attached to a tanker in Hormuz, which maritime sources called the first known successful limpet-mine strike there since the war began, and counted just over 30 attacks in October, about twice September’s total. The US ordered non-emergency embassy staff out of Riyadh. Qatari mediators returned to Tehran with a draft, which a senior Iranian official called “unacceptable.”
Why it matters:WTI ended almost exactly where it began, which hides the fact that the market spent the week pricing a dated risk window around November 3 rather than barrels already lost. On the January contract Brent rose $1.88 from Monday to $112.34, and Dutch TTF gained 10.30% to its highest close since at least April 15 (see the Energy table in Section B). Energy rose 10.57% over the month. For the Fed, crude above $100 is the channel through which a headline becomes a rate decision, and Chair Warsh named energy prices in his opening remarks on the day two colleagues voted to hike.
What to watch:Iran’s reply to the Qatari draft, Sunday’s OPEC+ meeting, and any US decision around the November 3 midterms.
BEARISH
4. The Haven That Didn’t Hold: Silver Falls 8.97% on the Week and Gold Breaks $4,000 as Treasuries Rally and Stocks Sell Off
The core facts:Gold closed the week at $3,884.97, silver at $49.13 and platinum at $1,434.40, all three their lowest closes since at least April 15. Most of the damage came in the last two sessions: gold lost 3.63%, silver 6.20% and platinum 3.94% on Friday alone. Kitco put spot gold at its lowest since October 6, 2025, and Reuters put silver down 31% and gold down 10% for the year. Copper fell only 1.60% on Friday and finished the week nearly flat. Analysts quoted by Kitco offered two explanations, margin selling to cover equity losses and oil-driven inflation that keeps the Fed hawkish; neither is established as the cause.
Why it matters:Metals fell through conditions that normally support them: lower yields, a softer dollar and a stock selloff, in the same week the Hormuz attacks intensified. A diversifier failed when equities needed one, leaving Treasuries to do that work alone, as the 10-year fell 7.1 bps on the week (see the Volatility & Treasuries table in Section B). This is now a persistent pattern rather than a one-week wobble: gold also fell 4.30% in the prior week. For allocators, it undercuts the assumption that a war-driven inflation shock is automatically good for gold.
What to watch:The $3,800 level one analyst expects to be tested, and whether the October payrolls report on November 6 changes the hike odds that keep pressure on non-yielding assets.
UNCERTAIN
5. A Falling Headline Over a Rising Market: Four in Five S&P 500 Stocks Rise on Alphabet’s Record Drop as Small Caps, Transports and Healthcare Finish the Week Higher
The core facts:On Thursday the S&P 500 fell 0.30% and the Nasdaq 100 1.38%, while the Russell 2000 rose 1.01%, the NYSE Composite 1.05% and seven of 11 sectors closed higher; according to AP, four of every five S&P 500 stocks rose. Friday’s 1.82% S&P decline was broader, but four sectors still rose. Over the week the Nasdaq 100 lost 1.98% while the Russell 2000 gained 1.29%, the Dow Transports 1.43% and the NYSE Composite 0.73%. Eight of 11 sectors rose on the week, led by Healthcare at +3.34%, where Lilly, Gilead, Merck and AstraZeneca all beat estimates. Yahoo Finance noted the Defiance ex-Magnificent Seven ETF is up more than 15% this year against 13% for the S&P 500.
Why it matters:The AI drawdown has not yet become a market drawdown. Money left a handful of capex-heavy names and went into healthcare, real estate and financials, helped by falling Treasury yields, which is rotation rather than de-risking. That is the case for optimism, and it has a limit: the cap-weighted indices still carry heavy weights in those names, and Friday showed that breadth can shrink quickly when the selling reaches chips. The VIX, at 19.44, sits almost exactly where it began the week.
What to watch:Whether the Russell 2000 holds above last Friday’s 2,775.90 through the midterms and the October payrolls report on November 6.
UNCERTAIN
6. Tariffs Become a Bargaining Chip: No Duty on Robotics, Canada Talks Stall, and Automakers Are Promised Relief if They Build in the US
The core facts:Reuters reported on Monday that the US and Canada were negotiating relief from Section 232 tariffs of up to 50% on steel and 25% on autos, possibly before the midterms; by Wednesday a Canadian official cited “limited progress” and Prime Minister Carney said “we’re not at that position right now.” A proclamation signed on Wednesday found that imports of robotics and industrial machinery threaten national security but set no tariff, ordering 180 days of negotiation instead, the second Section 232 case in a week to end that way. On Thursday Reuters reported the administration plans broad tariff relief for automakers making significant US investments, with Audi expected to pay about 10% rather than 15%; no formal notice has been issued. Caterpillar put its quarterly tariff cost at about $600 million.
Why it matters:Taken together, these actions show tariffs being used less as a fixed levy and more as a price negotiated case by case, conditional on investment or concessions. That lowers near-term cost risk for US capital projects and for carmakers already building here, but it makes the effective rate harder to forecast and favours companies with US plants over pure importers. Caterpillar’s 9.25% fall on Thursday is a reminder that the costs already in place still bite (see the weekly movers table in Section B).
What to watch:A Commerce Department notice setting eligibility for auto relief, and any Canadian deal before the November 3 midterms.
BEARISH
7. An Enforcement Week: DOJ Questions Nvidia’s Hugging Face Deal, the FTC Moves on Cintas, Dollar General and Personalized Pricing, and Prediction Markets Draw Felony Charges
The core facts:On Monday the FTC and 20 states sued Dollar General over register prices (shares -3.22%). On Tuesday Semafor reported the FTC plans to challenge Cintas’s $5.5 billion purchase of UniFirst (UniFirst down about 8% and Cintas about 5% at midday), and the CFTC sued Utah to protect federally registered prediction markets. On Wednesday Reuters reported the Justice Department is examining Nvidia’s $12.9 billion Hugging Face acquisition inside a broader conduct probe of its sales tactics, including alleged tying of GPU allocations to other products, and the FTC ordered nine companies including Walmart, Uber and Delta to explain personalized pricing. On Thursday Utah filed felony charges against Kalshi and its co-founders, and the SEC’s enforcement chief said prediction-market cases are coming. The Wall Street Journal also reported the Labor Department would finalize a PBM fee-disclosure rule.
Why it matters:The deregulatory reading of this administration needs a caveat. Regulators are pressing on market share, pricing power and consumer-facing practices across retail, health care and gig platforms. The Nvidia probe matters most for the index: Nvidia is the market’s largest weight, and a remedy that forced unbundled sales would reach its networking attach rates and the commercial leverage behind its margins. For the rest, the common thread is that business models built on opaque or algorithmic pricing now carry a federal overhang.
What to watch:Any second request on Hugging Face, an FTC vote on Cintas, CVS Health’s results on November 4 for its response to the PBM rule, and the Utah injunction ruling.
UNCERTAIN
8. From Rumor to Deal in Four Sessions: DoorDash Agrees to Buy Instacart for $17 Billion, Falling 6.10% on the Report and Rising 5.61% on the Announcement
The core facts:The Wall Street Journal reported advanced talks on Monday, valuing Instacart at about $17 billion, and DoorDash fell 6.10% to $168.44 while Instacart rose 7.87%. On Thursday DoorDash confirmed the deal at $65 a share, a 26% premium to Instacart’s October 22 close, with at least 75% of the consideration in cash and holders able to elect cash, stock or a combination. Instacart’s board approved it unanimously. DoorDash, which also reported results that day, closed up 5.61%.
Why it matters:The deal joins the largest US restaurant-delivery network to the leading grocery-delivery platform, sharpening competition with Uber and with Amazon in same-day local commerce. The reversal in the acquirer’s shares says investors moved from fearing the premium to accepting the logic, but the open question is regulatory. Antitrust concerns helped end the same two companies’ 2021 talks, and the deal arrives in a week when the FTC has shown its appetite for horizontal challenges (Story 7) and included both companies in its pricing inquiry.
What to watch:Uber’s results before the open on Wednesday, November 4, for its grocery response, and the FTC’s handling of the merger filing.
— Separating signal from noise since 2007. Apply for membership at join.recessionalert.comD. WEEK IN THE ECONOMY -> TOP
The week’s tension is a policy-vs-data divergence, with the market siding against the policymakers. Two FOMC dissents, a call from Logan for at least two more hikes and Musalem’s “soon” all point up, and 3.4% GDP growth with PCE inflation at 3.6% gives them an argument. Yet the data’s softer details pointed the other way: real disposable income fell 0.3%, private real wages fell 0.6% over the year, and the quarterly price gauges cooled sharply. Markets took that side. The 2-year yield fell 9.6 bps, Polymarket’s odds of another hike dropped 8 points to 70%, and rate-sensitive Real Estate and Utilities finished higher on the week. CME FedWatch near 76% for December shows the question is still open, and next Friday’s Non Farm Payrolls, after September’s 29,000, will decide whether a labor market this quiet can carry another increase.
POLYMARKET ODDS — WEEK-ON-WEEK SHIFT:
| Market | Last Friday | This Friday | Δ |
|---|---|---|---|
| US Recession by end-2026 | 8% | 7% | −1.0 pp |
| Another Fed hike in 2026 | 78% | 70% | −8.0 pp |
| Fed rate cuts ≥1 in 2026 | 4% | 3% | −1.0 pp |
UNCERTAIN
Fed Holds at 3.75%-4.00% in a 10-2 Vote With Two Dissents for a Hike; Logan Wants “At Least Two More” (Federal Reserve, Wed, Oct 28; Dallas Fed, Fri, Oct 30)
What they’re saying:Governor Cook and Cleveland’s Hammack preferred a quarter-point hike, and the statement said “Economic activity is expanding at a strong pace” and “Inflation remains elevated.” Chair Warsh said he does not believe in forward guidance “absent exigent circumstances, absent a crisis,” and announced a strategy-only FOMC meeting in 2027, leaving seven rate-setting meetings. On Friday Logan said the FOMC “needs to implement at least two more 25-basis-point rate increases,” Musalem that firming “will be necessary, and soon,” and Barkin that the question is pace. The ECB and Bank of Canada faced the same shock: Canada hiked 25 bps to 2.5% on Wednesday and the ECB held at 2.5% on Thursday.
The context:The market heard a hold, not a hawkish signal. The 2-year fell 4.1 bps on the day and 15.1 bps from Tuesday’s peak (see the Volatility & Treasuries table in Section B), and Friday’s speeches moved it just 1.2 bps. Polymarket’s hike contract went 77%, 80%, 77%, 70% across Tuesday to Friday (see the Polymarket table above), falling even as officials argued for more. With guidance withdrawn, every data release now carries more of the December call.
What to watch:Goolsbee on Monday, November 2 and Barkin on Thursday, November 5, ahead of the December 8-9 FOMC meeting.
BULLISH
Q3 GDP Grows 3.4%, Above the 3.2% Forecast, as the Quarterly Price Index Cools to 2.2% (BEA, Thu, Oct 29)
What they’re saying:Real GDP grew at a 3.4% annual rate, up from 2.2% in the second quarter, on faster investment and an upturn in government spending, partly offset by lower exports. Final sales to private domestic purchasers rose 4.9%. The GDP price index rose 2.2% against a 3.2% forecast and 6.1% in the second quarter, while quarterly core PCE prices slowed to 2.5% from 3.3%. GDPNow opened the fourth quarter at 3.2%.
The context:A growth beat with cooler prices is the combination bonds wanted: the 10-year fell 11.7 bps on the day and rate-sensitive Real Estate rose 2.18%, although no source tied the bond rally to these gauges specifically. The headline’s help from inventories and government spending means its strength is narrower than 3.4% suggests, although final private demand at 4.9% does not point to any slowdown. It leaves a recession story with little to work on, as Polymarket’s 7% odds show.
What to watch:GDPNow updates on Monday, November 2 and Wednesday, November 4, after ISM Manufacturing and ISM Services.
BEARISH
September PCE Inflation Climbs to 3.6%, In Line, as Real Spending Stalls and Real Income Falls 0.3% (BEA, Thu, Oct 29)
What they’re saying:The PCE price index rose 0.5% on the month and 3.6% on the year, matching forecasts, from 3.4% in August; core rose 0.3% and 3.1%, also in line, from 3.0%. Personal income rose 0.2% against 0.3% expected and spending 0.5% against 0.6%. Real PCE rose by less than 0.1%, real disposable income fell 0.3% and the saving rate stood at 3.8%.
The context:Bonds rallied because the print ruled out an upside surprise, not because it was good. Of September’s $113.1 billion rise in nominal spending, only $2.6 billion survived as real growth. That squeeze sits awkwardly beside a 3.4% GDP quarter, and it matters more for the months ahead than the headline does: households spending out of a 3.8% saving rate have limited room. Crude above $100 (see the Energy table in Section B) argues the pressure continues into October.
What to watch:The preliminary November Michigan survey on Friday, November 6 (prior 48.0), for household inflation expectations.
UNCERTAIN
Layoffs Stay Scarce and Wages Trail Inflation: Claims Slip to 194,000 Against 199,000 Expected; ECI Up 0.8% as Forecast (Labor Department, Thu, Oct 29; BLS, Fri, Oct 30)
What they’re saying:Initial claims fell 1,000 to 194,000 and continuing claims 21,000 to 1,701,000, both below forecasts. The third-quarter Employment Cost Index rose 0.8%, matching estimates, from 0.9%; over 12 months compensation rose 3.4%. Private-industry wages after inflation fell 0.6% over the year. The Chicago PMI’s employment reading jumped 10.3 points to its highest since April 2021.
The context:The labor market removes the case for easing without supplying a wage-driven case for hiking: few firings, little hiring after September’s 29,000 payroll gain, and pay running behind prices. The 2-year moved just 1.2 bps on the day of the ECI (see the Volatility & Treasuries table in Section B). Inflation pressure is coming from energy and input costs instead, with Chicago’s prices-paid index at its highest since December 2021.
What to watch:JOLTS on Tuesday, November 3 (prior 7.079M), then October payrolls and average hourly earnings on Friday, November 6.
BULLISH
Consumer Confidence Jumps to 91.7, Far Above the 81 Forecast, Though Expectations Lag (The Conference Board, Tue, Oct 27)
What they’re saying:The index rose 7.5 points to 91.7 from a revised 84.2. The Present Situation Index rose 8.6 points to 120.4 and the Expectations Index 6.9 points to 72.6. The labor differential improved 2.4 points to +5.3%. Twelve-month inflation expectations eased but stayed at 5.8%. Conference Board economist Fergus McCormick said confidence “remained on the long-term downward trend.”
The context:The 2-year rose 2.5 bps on the day of this 10.7-point beat, though no source tied the move to the release, and that rise did not survive the week. Two days later real income data told the opposite story about household finances. Mastercard’s third-quarter volumes and Starbucks’ 7.9% North America comparable sales suggest people are still spending, which fits the confidence reading better than the income one. Together they point to a consumer drawing on savings, not one in retreat.
What to watch:McDonald’s results on Wednesday, November 4, for low-income traffic, and Michigan sentiment on Friday, November 6.
— Know the probability before the market prices in the risk. Apply for membership at join.recessionalert.comE. WEEK IN EARNINGS -> TOP
TOP EARNINGS OF THE WEEK
BEARISH
1. Intel (INTC): −24.38% on the week | A Beat on the Quarter, but a Guide That Halves Expected EPS and No Positive Cash Flow This Year
The Numbers:Released AMC, Thursday, October 29. Revenue $16.51B vs $16.56B estimate (+21% YoY); adjusted EPS $0.52 vs $0.41. Non-GAAP gross margin 44.1%, above the roughly 42% guide. Fourth-quarter guidance: revenue $15B-$16B vs about $17B expected; adjusted EPS $0.25 vs about $0.43. Cash and equivalents $21.84B against $46.32B of long-term debt.
The Problem/Win:PC chips were roughly half of third-quarter revenue, and Intel blamed a sharper-than-expected drop on tough comparisons with last year’s Windows 10 upgrade cycle and on rising PC prices. It said supply constraints limit what it can sell into data centres, and that it does not expect positive cash flow this year. The week had opened with New Street upgrading the stock to Buy on a server-CPU shortage, so the print hit fresh optimism.
The Ripple:BofA cut the stock to Neutral on Friday and Seaport also downgraded it. The US government, Intel’s largest shareholder, faced a hit of nearly $12B on its stake during the session, per Reuters. The wider chip fallout is covered in Section C.
What It Means:The turnaround case now rests on data-centre and foundry execution while the PC base shrinks for two straight years, and the balance sheet leaves less room for error than the shares’ 78.21% year-to-date gain implies.
What to watch:AMD on Tuesday, November 3, for whether PC share shifted rather than shrank.
BEARISH
2. Alphabet (GOOGL): −12.61% on the week | Google Cloud Revenue Doubles, Search Grows 12%, and Quarterly Free Cash Flow Is Negative $9.1B
The Numbers:Released AMC, Wednesday, October 28. Revenue $127.58B vs $127.96B estimate (+25%); diluted EPS $2.12 vs $3.02 and $2.87 a year earlier, after an $8.7B loss on equity securities cut EPS by $0.55. Google Services $96.3B (+11%), Search & other $63.4B (+12%), YouTube ads $11.2B; Google Cloud $30.7B (+103%) with $11.1B of operating income. Operating income $40.6B (+30%), margin 31.8%. Capex $51.4B; trailing twelve-month free cash flow $19.7B.
The Problem/Win:Operating profit was strong and the cloud margin was exceptional, so the shortfall against EPS estimates was largely an investment mark. The issue the market priced was capex consuming all of operating cash flow, alongside Citizens’ concern that search monetisation “appears to be challenged” even with query growth at a five-year high.
The Ripple:The stock dragged Communication Services down 5.84% on the day. Citizens downgraded it to Market Perform. Section C carries the comparison with Microsoft and Amazon.
What It Means:Alphabet needs a capex plateau or visible cloud margin expansion to re-rate. Its stated intent to borrow in the US twice a year makes it a recurring issuer as well as a recurring spender.
What to watch:Any 2027 capex framework and the timing of its next bond sale.
BULLISH
3. Eli Lilly (LLY): +11.31% on the week | Revenue Up 39%, an EPS Beat of Nearly a Third, and 2026 Sales Guidance Raised by $5.5B
The Numbers:Released BMO, Thursday, October 29. Revenue $24.40B vs $22.58B estimate (+39%); non-GAAP EPS $7.48 vs $5.68. 2026 revenue guidance raised to $91B-$92B. Non-GAAP EPS guidance $35.00-$36.00, where an underlying raise of $4.07 at the midpoint was more than offset by $4.57 per share of acquired IPR&D charges. About $900M of quarterly revenue was one-time.
The Problem/Win:Tirzepatide drove the beat, with worldwide volume up 53% while realised prices fell 15% on China’s reimbursement listing. A day earlier retatrutide beat Ozempic 2 mg head-to-head, with weight loss of 19.5%-20.9% against 9.4%, though discontinuations ran higher at the top dose. Oral weight-loss drug Foundayo contributed $184M.
The Ripple:Lilly led Healthcare to the week’s best sector return at +3.34%, with Gilead, Merck and AstraZeneca also rising on their reports, and it pressures Novo Nordisk, which reports on November 4.
What It Means:Volume growth is more than absorbing price cuts, which is the test for the obesity franchise as it expands abroad. In a week that punished capital intensity, Lilly’s beat came from patient volume rather than a spending story.
What to watch:Novo Nordisk’s report on November 4 and Lilly’s 2027 guidance with fourth-quarter results in January.
WEEK AHEAD PREVIEW:
Q3 2026 earnings season was 60% complete as of FactSet’s October 30 update; the next five sessions bring 22 names above $100 billion, led by Apple, AMD and Palantir, in a week that also includes the November 3 midterms.
Marriott International (MAR) — BMO, Monday, November 2 — EPS est $2.84; market cap $104.12B; US RevPAR trend and travel demand amid Middle East disruption.
Apple (AAPL) — AMC, Monday, November 2 — EPS est $1.99; iPhone demand and the effect of rising memory costs on margins, now sharper after Intel’s warning on device demand.
Palantir (PLTR) — AMC, Monday, November 2 — EPS est $0.41; US commercial revenue growth, a test of AI software demand as AI-linked leadership reverses.
Vertex Pharmaceuticals (VRTX) — AMC, Monday, November 2 — EPS est $4.80; cystic fibrosis franchise growth and new-launch uptake.
Shopify (SHOP) — BMO, Tuesday, November 3 — EPS est $0.47; gross merchandise volume heading into the holiday quarter.
Pfizer (PFE) — BMO, Tuesday, November 3 — EPS est $0.73; full-year guidance and the obesity pipeline.
Eaton (ETN) — BMO, Tuesday, November 3 — EPS est $3.54; data-centre electrical orders against the AI spending concerns.
Marathon Petroleum (MPC) — BMO, Tuesday, November 3 — EPS est $25.37; refining margins, after Exxon’s Energy Products earnings more than doubled.
AMD (AMD) -10.88% — AMC, Tuesday, November 3 — EPS est $1.95; data-centre GPU revenue and PC exposure, the week’s key test after Intel’s report.
Amgen (AMGN) — AMC, Tuesday, November 3 — EPS est $5.79; obesity pipeline updates and the base business.
Arista Networks (ANET) -8.34% — AMC, Tuesday, November 3 — EPS est $1.08; AI networking orders from hyperscalers now under cash-flow scrutiny.
Booking Holdings (BKNG) — AMC, Tuesday, November 3 — EPS est $4.49; room-night growth and travel demand.
McDonald’s (MCD) — BMO, Wednesday, November 4 — EPS est $3.38; US comparable sales and low-income consumer traffic, after Starbucks’ 7.9% North America comp.
Uber Technologies (UBER) — BMO, Wednesday, November 4 — EPS est $0.86; delivery growth and its response to the DoorDash-Instacart deal.
CVS Health (CVS) — BMO, Wednesday, November 4 — EPS est $1.65; medical cost trends and PBM economics.
Qualcomm (QCOM) -11.13% — AMC, Wednesday, November 4 — EPS est $2.17; handset chip demand and memory-cost pressure on phone makers.
McKesson (MCK) — AMC, Wednesday, November 4 — EPS est $10.72; drug distribution volumes, including GLP-1 drugs.
ConocoPhillips (COP) — BMO, Thursday, November 5 — EPS est $3.05; production against its 2.29-2.32 million BOE/d third-quarter guide and cash returned at $100-plus crude.
Canadian Natural Resources (CNQ) — BMO, Thursday, November 5 — EPS est $1.04; oil sands production growth and capital returns.
Parker-Hannifin (PH) — BMO, Thursday, November 5 — EPS est $8.21; aerospace orders and backlog, now reported on a 12-month rolling basis.
Southern Company (SO) — BMO, Thursday, November 5 — EPS est $1.71; data-centre load growth and contracted large-load demand.
Enbridge (ENB) — BMO, Friday, November 6 — EPS est $0.34; the $41 billion secured capital backlog and the timing of Mainline Optimization Phase 2.
Excluded as ADRs: Arm and Novo Nordisk (Nov 4), Toyota and Sony (Nov 5). Just below the $100B threshold: Cloudflare ($99.95B, Nov 5 AMC), Duke Energy ($99.33B, Nov 5 BMO) and Airbnb ($98.43B, Nov 5 AMC).
— US market commentary trusted by family offices and institutions. Apply for membership at join.recessionalert.comF. NEXT WEEK SETUP -> TOP
UPCOMING RELEASES:
| Date | Event | Why It Matters |
|---|---|---|
| Mon, Nov 2 | ISM Manufacturing PMI 10:00 AM (prior 54.5) | First national read after the Chicago PMI’s miss and its sharp jump in prices paid; a firm prices component would feed the case for a December hike. |
| Mon, Nov 2 | ISM Manufacturing Employment 10:00 AM (prior 52.7) | Tests whether the Chicago survey’s 10.3-point hiring jump shows up nationally ahead of payrolls. |
| Mon, Nov 2 | Atlanta Fed GDPNow 11:00 AM (prior 3.2%) | Updates the fourth-quarter estimate that opened at 3.2%, close to the third quarter’s 3.4% pace. |
| Mon, Nov 2 | Fed Goolsbee Speech 11:15 AM | Adds a further voice after Friday’s Logan, Musalem and Barkin remarks; any pushback on hikes would widen the split. |
| Tue, Nov 3 | JOLTs Job Openings 10:00 AM (prior 7.079M) | Shows whether labor demand is holding in a market with few layoffs and little hiring. |
| Tue, Nov 3 | Factory Orders MoM 10:00 AM (prior 0.1%) | Carries revised durable goods data after September’s transportation-led headline beat. |
| Tue, Nov 3 | API Crude Oil Stock Change 4:30 PM (prior -2.031M) | Early read on whether US inventories keep drawing with crude above $100. |
| Tue, Nov 3 | Midterm Elections (time not given) | Oil traders have dated escalation risk around the vote, and the result reshapes trade and fiscal politics in Congress. |
| Wed, Nov 4 | MBA 30-Year Mortgage Rate 7:00 AM (prior 7.37%) | First reading to capture the late-week fall in the 10-year yield; purchase demand ran 18% below last year. |
| Wed, Nov 4 | ADP Employment Change 8:15 AM (prior 90K) | Private-payroll guide two days before the official report, after September’s 29,000 payroll gain. |
| Wed, Nov 4 | Balance of Trade 8:30 AM (prior -$105.6B) | Full September report following the wider advance goods deficit that weighed on third-quarter net exports. |
| Wed, Nov 4 | Exports 8:30 AM (prior $315.2B) | Petroleum exports were the main drag in the GDP report, so the mix matters as much as the total. |
| Wed, Nov 4 | Imports 8:30 AM (prior $420.8B) | Indicates how much of the investment boom is being met from abroad, and how much landed in inventories. |
| Wed, Nov 4 | ISM Services PMI 10:00 AM (prior 54.9) | The largest part of the economy, and its prices component is central to whether inflation pressure is broadening beyond energy. |
| Wed, Nov 4 | EIA Crude Oil Stocks Change 10:30 AM (prior -1.892M) | A third straight draw would strengthen the physical case behind the war premium. |
| Wed, Nov 4 | EIA Gasoline Stocks Change 10:30 AM (prior 3.87M) | Another large build would temper the pass-through from crude to pump prices and headline inflation. |
| Wed, Nov 4 | Atlanta Fed GDPNow 11:00 AM | Second fourth-quarter update, incorporating the trade and ISM Services reports released that morning. |
| Thu, Nov 5 | Initial Jobless Claims 8:30 AM (prior 194K) | Any climb from historically low levels would be the first crack in the no-layoffs picture. |
| Thu, Nov 5 | Nonfarm Productivity QoQ Prel 8:30 AM (prior 1.4%) | Strong output with little hiring should show up here, and it decides how far 3.4% pay growth is inflationary. |
| Thu, Nov 5 | Fed Barkin Speech 9:10 AM | First chance to hear whether the week’s data changes his view that pace is the open question. |
| Fri, Nov 6 | Non Farm Payrolls 8:30 AM (prior 29K) | The week’s deciding print for December: another weak gain undercuts the hawks, a rebound arms them. |
| Fri, Nov 6 | Unemployment Rate 8:30 AM (prior 4.2%) | Logan calls the labor market balanced and perhaps tightening; a lower rate supports her two-hike case. |
| Fri, Nov 6 | Average Hourly Earnings MoM 8:30 AM (prior 0.1%) | After a soft 0.1%, a firmer print would test the view that wages are trailing inflation. |
| Fri, Nov 6 | Average Hourly Earnings YoY 8:30 AM (prior 3%) | Annual pay at 3% against PCE inflation of 3.6% is the real-income squeeze in one comparison. |
| Fri, Nov 6 | Participation Rate 8:30 AM (prior 61.8%) | Shows whether labor supply, rather than demand, is keeping unemployment low despite slow hiring. |
| Fri, Nov 6 | Michigan Consumer Sentiment Prel 10:00 AM (prior 48.0) | Household inflation expectations, at 4.7% for the year ahead in October, are what the Fed’s hawks say they fear losing. |
WHAT TO WATCH NEXT WEEK:
1. Does the oil market’s dated risk resolve on November 3? Traders have tied crude’s premium to escalation after the midterms, while Qatari mediation and Sunday’s OPEC+ meeting offer the other path; a quiet vote could take out part of the premium without any deal.
2. Is PC weakness Intel’s problem or the market’s? AMD and Arista report on Tuesday after falling 10.88% and 8.34% on Friday. Apple’s Monday report adds the memory-cost question on devices, and a Nasdaq 100 close below about 28,102 would mark a 10% decline from October 6.
3. Can a labor market with 29,000 monthly payroll growth carry a December hike? Friday’s Non Farm Payrolls and unemployment rate decide whether Logan’s two-hike path has data behind it, or whether the market’s lower odds were right.
4. Will credit markets keep paying for the build-out? Final pricing and long-end spreads on Microsoft’s bond sale, and any follow-on jumbo issue, will show whether investors treat hyperscaler debt differently after a week that punished negative free cash flow.
— US market commentary trusted by family offices and institutions. Apply for membership at join.recessionalert.comG. CHART OF THE WEEK -> TOP
WHY THIS CHARTThe auction, nuclear and tariff charts each explained one story, but this one explains a pattern that ran all week: the war’s energy shock landing on Europe while America’s supply keeps it at arm’s length, as Dutch TTF gained 10.30% and the US December contract fell. It also shows why this shock has not behaved like a classic inflation scare in US assets, the same puzzle behind falling Treasury yields and failing metals.
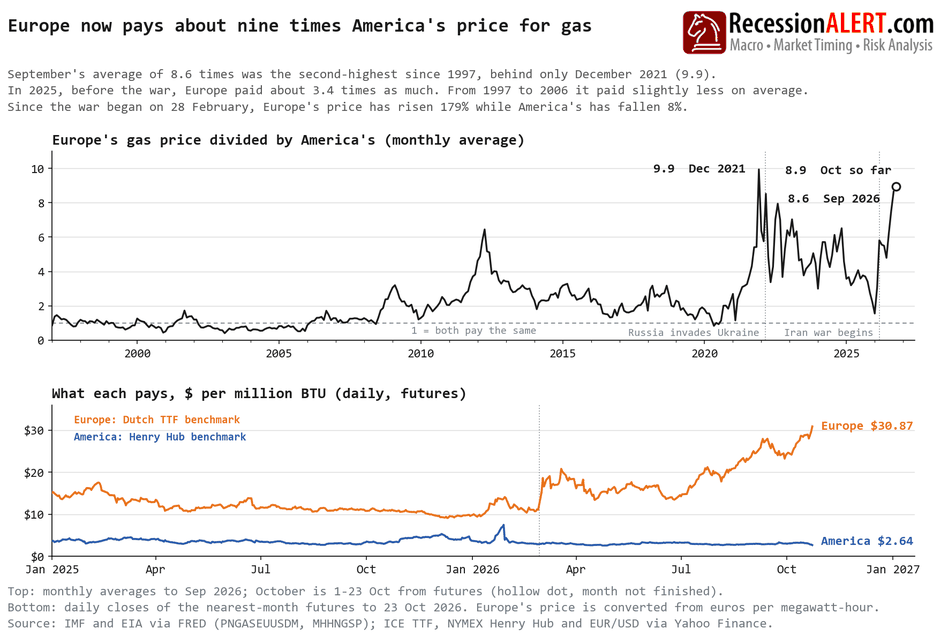
ORIGINAL CHART ANALYSIS — FROM MONDAY’S MIBEurope’s gas costs about a third of its 2022 peak, yet the gap with America is wider. In September Europe averaged $25.49 per million BTU, against $69.98 in August 2022; divided by America’s price, that came to 8.6, above that August’s 7.9. The extreme is coming from the bottom of the fraction. In 2022 the Henry Hub benchmark, America’s reference price, climbed alongside Europe’s to $8.81. This time its futures are -8% since the Iran war began on 28 February, while Europe’s are +179%. The reason is arithmetic. In its October outlook, the Energy Information Administration expects US output to rise by 3.9 billion cubic feet a day in 2027 while exports of liquefied gas — the only way American gas reaches Europe — rise by just 1.0 billion. Exports take about a sixth of what America produces; the rest stays home and competes for American buyers, which is why the agency sees Henry Hub averaging $3.16 next year. The war lifted Europe’s side of the fraction; America’s growing supply keeps the other side pinned near $3 — short of a hard winter at home, with US storage only 1% above normal. That pairing is new: the only two other months since 1997 at 8 or more, December 2021 and March 2022, came in the run-up to and opening of Europe’s Russian gas crisis. An 8x ratio used to take a European emergency — now it takes little more than cheap American gas. What it means: Europe’s gas shock should stay out of American winter bills. Cheap wholesale gas is not cheap gas at home, though: utility gas prices are still up 5% on a year, faster than inflation. US chemical and fertiliser makers, which use gas as fuel and raw material, keep paying a fraction of what European rivals pay. That edge supports their margins while it lasts. For the economy, cheap fuel is a buffer against an energy war abroad. The test is a hard American winter: two straight months above $5 at Henry Hub, last seen in 2022.
MIB Weekly Digest Ver. 2.11
For professional investors only. Not investment advice.
© 2026 RecessionALERT.com

Comments are closed.