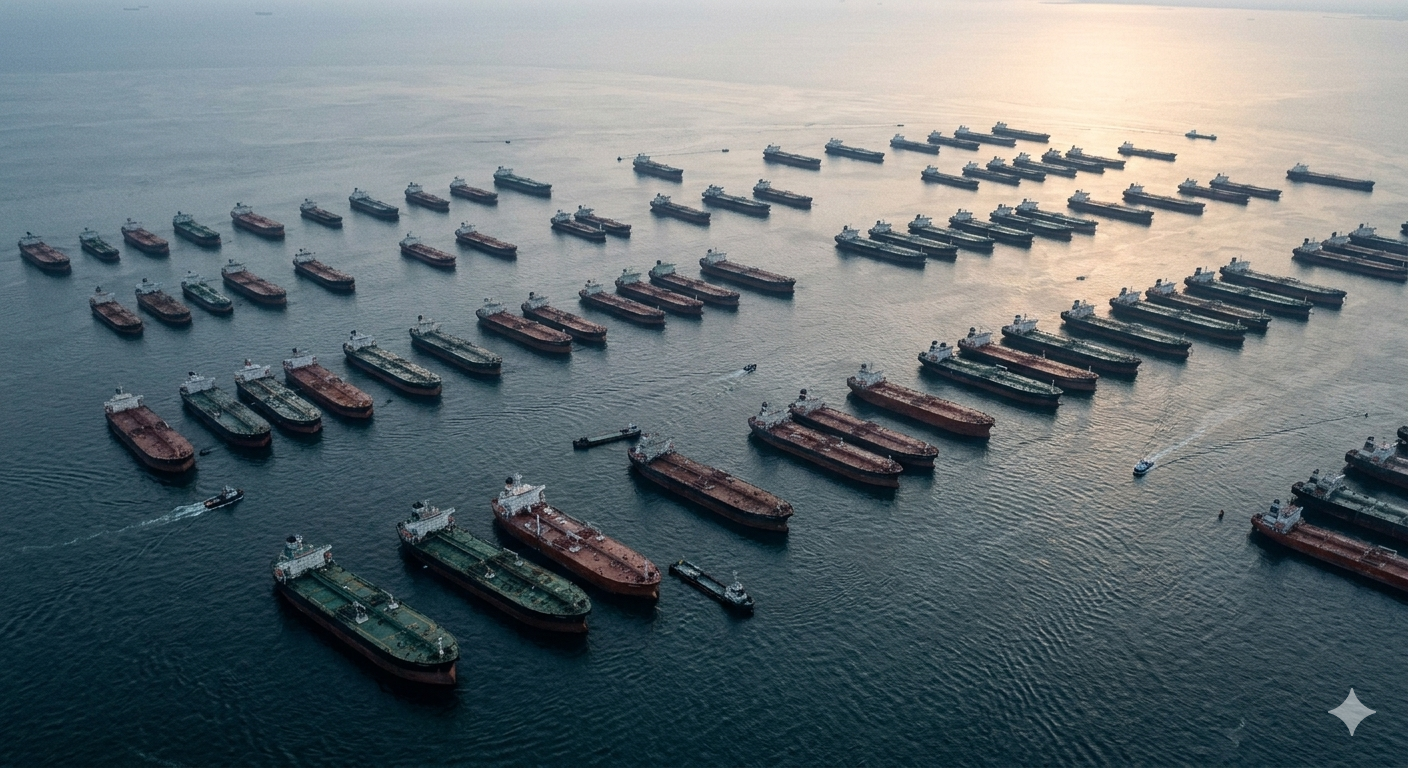
On April 11, Donald Trump posted a satellite image of 68 supertankers assembled in the Gulf of Mexico, each bound for American ports to load crude oil. “GREAT!!!” read the caption. Behind the image lay an argument that had been building for weeks across cable television and social media: the United States is the world’s largest crude producer, at 13.6 million barrels per day, and whatever the Strait of Hormuz — the 21-mile chokepoint between Iran and Oman through which approximately 20 million barrels per day of oil and petroleum products transit — removes from global circulation, American wells and terminals can replace. The argument is wrong: not at the level of the production number, which is accurate, but at every step between the wellhead and the water’s edge.
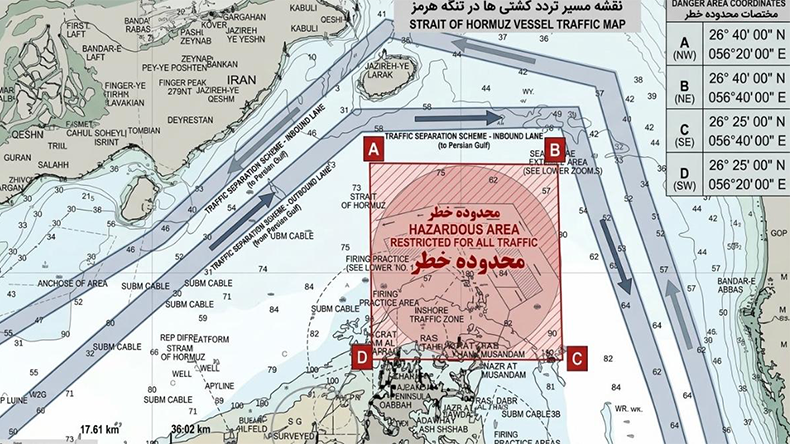
The Strait of Hormuz was effectively closed in early March 2026 following the outbreak of US-Israeli air operations against Iran. On April 12, after peace talks in Islamabad collapsed over Iran’s refusal to surrender its nuclear programme or cede control of the strait, President Trump formalised the closure by announcing a US Navy blockade — with orders to intercept any vessel that had paid Iran’s $2 million transit toll and to clear Iranian mines from the waterway. Iraq, Saudi Arabia, Kuwait, the United Arab Emirates, Qatar, and Bahrain have together shut in approximately 9.1 million barrels per day of production, according to the EIA’s April 2026 Short-Term Energy Outlook. The question is not whether this disruption is real. It is whether the United States can close the gap.
It cannot — not in any timeframe measured in months rather than years. The claim rests on four conflations that do not survive contact with the physical infrastructure: US production volume against net exportable crude surplus; the country’s net crude position against its net total petroleum position; total commercial petroleum stocks against genuinely exportable crude above minimum operating levels; and the Strategic Petroleum Reserve against a freely deployable export buffer. Strip away each conflation, and the United States has approximately 2.4 million barrels per day of net new exports above the pre-war baseline — eighteen percent of the IEA’s 13 million barrel per day net market loss, falling toward fifteen percent when the Strategic Petroleum Reserve drawdown ends 31 May — deliverable late, insured at 25 times the pre-crisis rate, routed 30 days the long way around Africa. The water’s edge is where the claim dies.
The world’s largest crude producer imports 6.2 million barrels per day of crude oil and exports 4.9 million. These facts are not contradictory. They describe a refinery system built before the shale era for a grade of crude the Permian Basin does not produce. The United States is simultaneously the world’s largest crude producer and a structural net importer of crude oil — and the distinction matters more today than at any point since the 1970s.
American refineries consume approximately 20.4 million barrels per day of total petroleum. Against 13.6 million barrels per day of domestic crude production, the structural deficit is approximately 6.9 million barrels per day — filled by imports. The United States is a net crude importer by approximately 2.2 million barrels per day. This is not a paradox; it is the arithmetic of a refinery system optimised for a different era, running grades it no longer produces at the volumes it needs.
The mechanism is grade. US shale production is overwhelmingly light sweet crude — low-sulfur, high-API-gravity oil that commands a premium in specialist markets but cannot efficiently run the coking and hydrocracking units that dominate Gulf Coast refinery capacity. Those units were built between the 1940s and 1980s, when Middle Eastern heavy crude was the world’s dominant feedstock. Saudi Arab Light (API gravity 33, sulfur content 1.8%) and Arab Heavy (API gravity 28, sulfur 2.8%) are the grades those units were designed for. The Permian Basin’s WTI-grade crude (API gravity above 40, sulfur below 0.5%) cannot run them efficiently. So the United States exports the light crude its refineries do not need and imports the heavy sour crude they require. This was an arbitrage. In a Hormuz crisis, it becomes the central constraint.
Two figures capture the position precisely. The 2.8 million barrels per day “net exporter” figure that circulates in commentary — cited by Energy Secretary Wright and repeated across social media, fact-checked “Half True” by WRAL in March 2026 — is the net total petroleum surplus: it counts crude oil, refined products (gasoline, diesel, jet fuel), natural gas plant liquids, and all other petroleum-derived commodities. It is technically accurate for total petroleum. For crude oil alone — the only commodity that can fill a foreign refinery’s crude slate — the United States is a net importer by approximately 2.2 million barrels per day. Refined products cannot substitute as crude. They cannot be sent to Asian or European refineries and processed into the fuel those economies need.
US is a net importer · EIA 2025
Includes refined products · EIA 2025
What about stocks? Total US commercial petroleum stocks stood at approximately 850 million barrels as of the week ending April 3, 2026, according to the EIA’s Weekly Petroleum Status Report. The figure circulates widely. Its composition does not: approximately 240 million barrels is gasoline, 115 million is distillate and diesel, 30 million is jet fuel — all refined products that cannot be shipped as crude to foreign refineries. Commercial crude stocks stand at approximately 465 million barrels, against a minimum operating inventory of approximately 400 million barrels required to keep US domestic refining functional. The genuinely exportable buffer above that floor is approximately 65 million barrels. At the 13 million barrel per day net market loss now identified by the IEA, 65 million barrels covers five days — once, and then exhausted. The 68 supertankers in Trump’s post, at 2 million barrels of capacity each, would carry 136 million barrels — nearly double the exportable buffer, and drawn from a supply chain that requires those stocks to keep US refineries running. The Strategic Petroleum Reserve — which holds approximately 415 million barrels at 57 percent of its 714 million barrel capacity after years of drawdowns and partial refills — faces a maximum withdrawal rate of approximately 4 million barrels per day and a 120-day physical delivery lag on Trump’s authorised 172 million barrel release. It is an emergency buffer against short disruptions. It is not a substitute for 9.1 million barrels per day of ongoing production.
Total commercial petroleum stocks of approximately 850 million barrels include all refined products. Only commercial crude stocks above minimum operating levels are exportable as crude — approximately 65 million barrels, covering five days of the IEA’s 13 million barrel per day net market loss, available once. After that buffer is drawn, US domestic refining requires every barrel that remains.
Trump’s 172 million barrel SPR release is contracted at approximately 1.5 million barrels per day through 31 May 2026. Department of Energy awards cover 45.2 million barrels of April–May delivery to eight contracted buyers. SPR stocks are now at a three-decade low. Approximately 270 to 500 thousand barrels per day of the drawdown is routed through Gulf terminals to foreign buyers — indistinguishable from commercial production in EIA weekly data, and roughly equivalent to the export overshoot above the pre-crisis six million barrel per day envelope. The reserve that took years to refill sits depleted at the moment its deterrent value matters most.
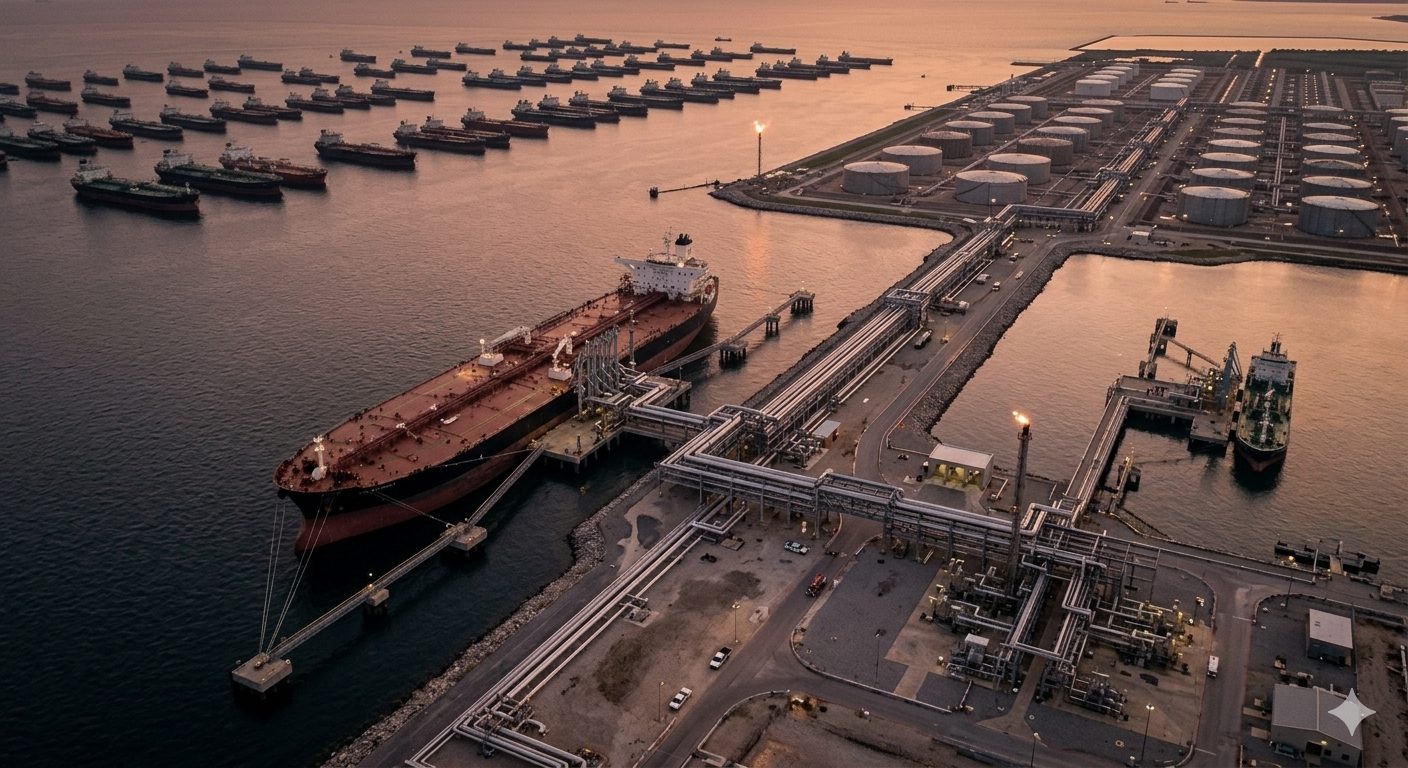
Oil is the first cascade. Gas is the second, compounding the first without solving either. Qatar supplies approximately 9.3 billion cubic feet per day of liquefied natural gas — natural gas supercooled to minus 162 degrees Celsius, reduced to 1/600th of its original volume to enable seaborne transport — through the Strait of Hormuz. That figure represents approximately 20 percent of global LNG trade and the single largest source of seaborne gas supply for Japan, South Korea, Taiwan, and portions of India. The same chokepoint that has closed to crude tankers has closed to LNG carriers.
On March 18, Iranian forces struck Qatar’s Ras Laffan Industrial City — the world’s largest LNG export complex, housing the liquefaction trains, storage tanks, and marine berths through which Qatari gas reaches global markets — and destroyed approximately 17 percent of production capacity. QatarEnergy declared force majeure on all export commitments: a legal suspension of contractual obligations due to circumstances beyond the shipper’s control. Approximately 50 Qatari LNG tankers are currently sitting idle across Asian ports, with cargo they cannot reload and contracts they cannot fulfil. Asian LNG spot prices — the market rate for gas traded outside long-term contracts — have risen more than 140 percent. The annual revenue impact on Qatar exceeds $20 billion.
The United States operates approximately 15 billion cubic feet per day of LNG export capacity — the world’s largest — but almost entirely under long-term supply agreements signed years before the crisis. Uncommitted spot availability is estimated at 1 to 3 billion cubic feet per day at most. Three major US LNG projects that would provide structural relief have first-cargo dates of 2027 and 2028. Emergency permitting can compress construction timelines by weeks. It cannot compress them by years. The spot LNG the United States can offer now covers perhaps 10 to 30 percent of Qatar’s disrupted export volume — at 140-percent-premium spot prices, not under the long-term contract pricing that made Qatari gas affordable to begin with.
The LNG cascade matters here because it is not parallel to the crude crisis — it is multiplicative. The countries facing the most acute crude supply disruption are the same countries facing the most acute LNG disruption. Japan sources approximately 90 percent of its crude imports through Hormuz and is the world’s largest LNG importer. South Korea sources approximately 95 percent of its crude through Hormuz and is the world’s third-largest LNG importer. A simultaneous double shock on input energy — crude for transport and heavy industry, LNG for power generation and petrochemicals — hitting the same economies does not simply add the two disruptions. It removes the ability to substitute one energy source for the other, which is the normal industrial response to a single-commodity shock.
Iranian forces struck Ras Laffan Industrial City, Qatar’s primary LNG export complex. Confirmed 17 percent production capacity destroyed. QatarEnergy declared force majeure on all contractual LNG commitments. Approximately 50 LNG tankers remain stranded in Asian ports. Asian LNG spot prices up more than 140 percent.
EIA data shows US crude exports rising from under one million barrels per day in 2016 — the year following the lifting of the four-decade crude export ban — to approximately four million barrels per day before the war, and to a record 6.44 million barrels per day in the week ending 24 April 2026. The trend is accurate. The inference it invites — that exports can scale further to compensate for Hormuz-sourced shortfalls — does not survive contact with the infrastructure. Growth since 2016 reflected two things: the removal of a legal constraint and incremental investment in terminal capacity. Both are now exhausted. The ceiling that follows is not a production problem. It is a water’s edge problem.
Assume, for argument’s sake, that every barrel of redirectable US crude were directed to the markets most exposed to the Hormuz closure. The constraint is not the wells, the grades, or the contracts — though each of those bites. The constraint is the terminal gate: the point at which a Very Large Crude Carrier — a 300,000-deadweight-tonne vessel capable of transporting 2 million barrels of crude across an ocean — must be loaded from US soil.
Combined nameplate capacity of US Gulf Coast export terminals: approximately 7.1 million barrels per day. Before the war, approximately 4 million barrels per day flowed below that ceiling. Crisis exports hit 6.44 million barrels per day in the week ending 24 April 2026 — a sixty percent surge over the pre-war baseline and the highest weekly print in EIA history. Two compositional facts qualify the headline. Approximately 270 to 500 thousand barrels per day of that figure is Strategic Petroleum Reserve crude routed through Gulf terminals to foreign buyers under contract — a drawdown scheduled to end 31 May 2026. Approximately half of seaborne exports are leaving on Suezmax and Aframax vessels that bypass the deep-draft VLCC infrastructure the pre-crisis literature treated as the binding constraint. The ceiling has been pushed harder than expected; the underlying constraint has not been replaced. Post-31 May, headline exports should fall back toward the structural six million barrel per day envelope.
The Louisiana Offshore Oil Port — LOOP — is the only US facility capable of fully loading a VLCC at berth without lightering. It has loaded export VLCCs since February 2018, when the 48-inch LOOP Pipeline was made bidirectional to allow southbound flow from the Clovelly Hub to the offshore marine terminal. The capability exists. The throughput does not. LOOP export loadings collapsed to approximately 65,000 barrels per day in the first quarter of 2025 — the lowest quarterly volume since exports began, down seventy-two percent year-on-year. The reason is upstream of the terminal: the feeder pipeline network at Clovelly still runs predominantly inland toward refineries at St. James, Louisiana. The Swordfish Pipeline — proposed to reverse Clovelly’s southbound feed and unlock LOOP’s full export potential — is not yet built. The single US terminal capable of fully loading the world’s largest tankers sits idle for export, not because the berth cannot load, but because the pipeline network behind the berth still treats LOOP as the import terminal it was built to be in 1981.
The Corpus Christi alternative — specifically the Enbridge Ingleside Energy Center, the renamed Moda terminal acquired by Enbridge in 2021 — has materially expanded since the pre-crisis snapshot. The US Army Corps of Engineers and the Port of Corpus Christi completed the Channel Improvement Project on 2 June 2025: the Corpus Christi Ship Channel was dredged from 47 to 54 feet of authorised depth, widened from 400 to 530 feet, and given barge shelves enabling two-way deep-draft traffic. Enbridge Ingleside dredged its own dock basins to 55 feet, raising VLCC partial-load capacity to approximately 1.5 million barrels per vessel — a twenty-five percent uplift over pre-project loadings. The terminal shipped more than 2.4 million barrels per day of crude in March 2026, approximately sixty percent of total US crude exports. The 47-foot channel that once forced offshore lightering for every VLCC departure ceased to be the binding constraint nine months before the Hormuz crisis began. What remains: a fully laden VLCC still requires approximately 70 feet of draft, so partial loading inside the channel — followed by offshore top-off via Aframax shuttle — remains the dominant departure pattern for full-cargo runs to Asia. The Houston Ship Channel is draft-limited to Aframax and Suezmax-class vessels; VLCCs cannot enter Houston laden, and the workaround that exists at Corpus Christi does not exist there.
Four offshore deepwater VLCC loading terminals are under construction along the Gulf Coast: SPOT, developed by Enterprise Products; Texas GulfLink, by Sentinel Midstream; Blue Marlin, by Energy Transfer; and Bluewater Texas, by Phillips 66. These are the facilities that would resolve the water’s edge problem and transform the US Gulf Coast into a genuine VLCC export hub capable of competing with the loading infrastructure at Ras Tanura, Kharg Island, and Ruwais. The earliest of the four is projected to reach first cargo in 2027. Most arrive in 2028 or 2029. Their combined capacity will matter enormously — in three to five years.
April 2026
Suezmax/Aframax bypass VLCC infrastructure
Includes ~270-500K b/d SPR through-flow
Net new: ~2.4M b/d (~1.9-2.1M post-SPR)
Fleet efficiency halved · War risk 25x
War risk insurance — the premium a vessel owner pays to cover a hull against combat damage on a voyage through or near a conflict zone — has risen from approximately 0.02 to 0.05 percent of hull value per voyage before the crisis to approximately 5 percent now: a 25-fold increase. A tanker owner insuring a $100 million VLCC now pays approximately $5 million per voyage against $200,000 before the blockade. VLCC charter rates — the daily hire cost for the vessel itself — reached a record $423,736 per day. These costs travel with the barrel. They are not absorbed at the terminal; they are passed through to the buyer at destination, compressing the economics of US crude for every market that is not connected by short-haul pipeline.
| Component | Volume | Mechanism |
|---|---|---|
| SPR drawdown to foreign buyers | ~270–500K b/d | 1.5M b/d total drawdown × ~18% historical export share; ends 31 May 2026 |
| Commercial export surge | ~1.9–2.1M b/d | CCSCIP June 2025 (47→54 ft) + EIEC dock dredge to 55 ft + ~46% Suezmax/Aframax mix bypassing VLCC ceiling |
| Total net-new above pre-war | ~2.4M b/d | 18% of IEA 13M gap; falls toward 15% post-SPR |
Most of the surge is commercial — pre-existing infrastructure plus the war premium pulling US light sweet crude through every available channel. The SPR adds approximately 16 percent of the increment above pre-war flows. When the drawdown ends 31 May, the structural rate sits roughly two million barrels per day above the pre-war baseline.
US crude exports reached 6.44 million barrels per day in the week ending 24 April, the highest weekly print in EIA history. Unlike OPEC term contracts, US crude trades largely on WTI differentials, with barrels free to follow premium bids wherever they emerge. That flexibility does not solve the arithmetic. Redirecting existing flows to Hormuz-starved markets does not add supply to the world. The approximately 4 million barrels per day moving before the war was already absorbed by refineries in Europe and Asia. Diverting those barrels to Asia’s most exposed buyers creates an equivalent deficit in Hamburg and Rotterdam. The shortage relocates; it does not shrink. The only volume that does not rob another buyer is the increment above the pre-war baseline: approximately 2.4 million barrels per day — the genuine crisis-surge above prior flows. Two qualifications shrink that figure further. Approximately 270 to 500 thousand barrels per day of the headline is Strategic Petroleum Reserve crude routed through Gulf terminals to foreign buyers — a drawdown scheduled to end 31 May 2026, after which the headline reverts toward the structural six million barrel per day envelope. Approximately half of seaborne exports are leaving on Suezmax and Aframax vessels that bypass the deep-draft VLCC infrastructure the pre-crisis literature treated as the binding constraint. Against a global shortfall measured in millions of barrels per day, that is the margin of error on the estimate of the shortfall itself.
The four deepwater terminals that would solve the water’s edge problem are under construction on the Gulf Coast. The earliest opens in 2027. The crisis is April 2026.
The arithmetic is not close. Twenty million barrels per day flow through the Strait of Hormuz. Every claimed substitute, examined separately, fails to approach the gap — and the failure is not a matter of degree. It is structural, physical, and measured in years rather than months.
The shortfall figure most widely cited — the EIA’s 9.1 million barrels per day — is gross production shut-in by the six Gulf nations bordering Hormuz. It is not the figure that reaches global markets. The IEA’s April 2026 Oil Market Report places the net export loss at approximately 13 million barrels per day after Saudi Petroline (the East-West Pipeline running to Yanbu on the Red Sea) and the UAE Habshan-Fujairah pipeline (running to the Indian Ocean coast) absorbed approximately 3.2 million barrels per day of redirected flow. Both pipelines are now at or near capacity. There is no further expansion available. The 13 million barrel figure is the binding measure of supply removed from global markets — and the figure against which every claimed substitute must be measured.
United States. Net new exports above the pre-war baseline: approximately 2.4 million barrels per day — eighteen percent of the 13 million barrel per day shortfall, falling toward fifteen percent when the Strategic Petroleum Reserve drawdown ends 31 May 2026. This assumes the barrel can be loaded through Gulf Coast terminals already operating near their structural ceiling, insured at 25 times the pre-crisis rate, loaded onto VLCCs that cannot use the Panama Canal, routed 30 days the long way around the Cape of Good Hope, and delivered to refineries capable of processing light sweet crude. Japan, South Korea, and India — the three largest Hormuz-dependent buyers — have refinery configurations weighted toward the medium and heavy sour grades the Gulf produces. The most exposed buyers are also the most constrained in what US crude they can run.
Canada. Western Canadian production runs at approximately 5 million barrels per day behind a pipeline system operating at 98 percent of its 5.2 million barrel per day export capacity. Spare pipeline capacity at the end of 2025 was 100,000 barrels per day. The next pipeline relief — Enbridge’s Mainline 1 expansion — adds 150,000 barrels per day and arrives in 2027. Canadian oil sands crude — produced from open-pit mines and steam injection complexes (Steam Assisted Gravity Drainage, or SAGD) requiring 5 to 10 years from investment decision to first barrel — is heavy sour, requiring the same specialised upgrader capacity as the Middle East barrels it is supposed to replace. The bulk of the pipeline system flows south into US refineries. Canada acquired a Pacific water’s edge in May 2024 with the completion of the Trans Mountain Expansion — an 890,000 barrel per day corridor from Alberta to Westridge Marine Terminal in Burnaby, British Columbia, with a planned upgrade to 1.2 million barrels per day. But Westridge handles Aframax-class vessels, not VLCCs; and the heavy sour dilbit it exports requires the same specialised refinery configurations as the Middle East crude it is meant to replace. At full upgraded capacity, Canada’s Pacific export ceiling is approximately 1.2 million barrels per day — nine percent of the shortfall.
Venezuela. Production stands at approximately 934,000 barrels per day against a historical peak of 3.5 million barrels per day in the late 1990s. Restoring output to 2.5 million barrels per day would cost $58 billion and require 7 to 10 years, according to Rystad Energy; a path to 3 million barrels per day would cost approximately $180 billion through 2040. JPMorgan estimates that with political stability, unrestricted operations, and new licensing deals, Venezuela could reach 1.2 million barrels per day within months and 1.4 million barrels per day within two years — nine to eleven percent of the current shortfall, at maximum optimism, on the far side of an investment cycle. No major pipeline or processing facility in Venezuela has been materially updated in 50 years. Energy Secretary Chris Wright reported in April 2026 that approximately 150 million barrels of Venezuelan crude had been sold under US government control since January 3rd — a cumulative figure implying a flow rate of approximately 1.5 million barrels per day — sixty percent above Venezuela’s actual production. “Sold” means contracted and committed; it does not mean loaded, shipped, and delivered. The political framing was a chess move: the United States seized Maduro, installed a cooperative government, and unlocked a giant reserve sitting three days’ sail from the Gulf Coast. The physical reality is that the reserve is stranded behind infrastructure that has not been meaningfully updated in fifty years. You cannot politics your way past degraded pipelines and collapsed compression capacity. This is a commercial arrangement at the margins of a 9.1 million barrel per day shortfall, not a supply response to it.
Every claimed substitute, examined on its own terms:
| Source | Paper Claim | Physical Ceiling |
|---|---|---|
| US net-new above pre-war baseline | 2.4M b/d | ~2M b/d post-SPR |
| Venezuela | 1.5M b/d | ~934K b/d |
| Canada · Westridge / Pacific | 1.2M b/d | ~890K b/d |
| Combined maximum | ~5.1M b/d 39% of 13M gap |
~3.8M b/d post-SPR 29% of 13M gap |
At physical reality, every non-Hormuz substitute available today covers approximately 29 percent of the IEA’s 13 million barrel per day net market loss — with the Strategic Petroleum Reserve contribution scheduled to end 31 May 2026. The remaining seventy-one percent has no answer that arrives before 2027.
Delivery Cost. The delivery problem compounds what the loading problem already established. A VLCC departing the US Gulf for Tokyo Bay travels approximately 14,000 nautical miles via the Cape of Good Hope — a 40 to 45 day voyage. The same vessel from Ras Tanura to Tokyo covers 6,500 nautical miles in 18 to 20 days. That difference halves the annual delivery frequency of each vessel: a VLCC on the US-Asia run completes four to five round trips per year; on the Middle East-Asia run, eight to nine. Delivering the same annual volume from the US Gulf therefore requires approximately twice the number of VLCCs — vessels that do not exist in surplus and cannot be built on a crisis timeline. Fuel burn compounds the fleet problem: at 80 to 100 tonnes per day, an extra 50 to 60 days at sea per round trip adds approximately $1.5 to $2 million in bunker costs per voyage — roughly $1 per barrel on a cargo already repriced upward by record VLCC charter rates of $423,736 per day. War risk insurance — already 25 times the pre-crisis rate — attaches regardless of routing. The buyer in Tokyo, Seoul, or Mumbai receives an American barrel that has absorbed two extra months of charter fees, $2 million in additional fuel burn, and insurance premiums calibrated for a conflict it sailed around. That barrel is not price-competitive with the Middle East barrel it is supposed to replace. The Middle East barrel simply no longer arrives.
International Energy Agency. Strategic reserves. The IEA coordinates emergency petroleum reserves among member countries totalling approximately 1.6 billion barrels — including the US SPR, European national reserves, and Japanese and South Korean government stocks. A coordinated release at maximum draw rate covers 60 to 90 days at reduced consumption levels. It depletes a buffer that took years to accumulate and will require years to refill. It does not produce a single barrel of new supply. It is a bridge across a closure now in its sixth week — and every day of bridge burns buffer that cannot easily be replaced at a Hormuz premium.
The market has already rendered its verdict on the arithmetic. The Brent-WTI spread — the differential between the benchmark for internationally traded seaborne crude (ICE Brent) and the benchmark for landlocked US crude (NYMEX West Texas Intermediate) — widened from its normal range of approximately $4 per barrel to a peak of $25 per barrel on March 31, 2026. As of April 6, it stood at $11.59. Brent commands a premium because the world is short of supply it cannot physically reach. WTI trades at a discount because the US barrel is landlocked behind the water’s edge this note has traced. The spread does not resolve until either the Hormuz closure ends or the US builds the infrastructure to move its crude across the gap. It is the market’s real-time assessment of the thesis.
Normal differential: approximately $4 per barrel. March 31, 2026 peak: $25 per barrel. April 6, 2026: $11.59 per barrel. The spread is not a trading anomaly — it is the water’s edge problem expressed as a price. Brent tracks global scarcity. WTI tracks a landlocked barrel behind infrastructure that cannot move it. The spread narrows when, and only when, the Hormuz closure ends or US VLCC export capacity is built. Until then, it is the arithmetic made visible.

The investor who has not yet distinguished between upstream oil producers and downstream energy consumers is carrying a position the physical arithmetic does not support. Energy producers with Permian light sweet crude exposure — the grades most exportable from US Gulf Coast terminals and most directly priced against a widening Brent premium — are better positioned than integrated majors with heavy crude refining exposure or energy consumers facing structurally higher input costs. Asian LNG-dependent industrials — fertilizer manufacturers, petrochemical producers, utilities running gas-fired generation — are absorbing input cost shocks that are structural in the 6-to-24-month window, not episodic. Infrastructure plays in US Gulf Coast deepwater VLCC terminals and Cape-route tanker capacity represent the medium-term asymmetric opportunity: these assets are being priced against a pre-crisis shipping regime that no longer exists, and their value inflects sharply when the first cargo is loaded. Physical commodity positions long US crude differentials against Brent capture the thesis directly — the Brent-WTI spread is the trade, and it resolves only when the water’s edge problem resolves.
The United States holds the world’s largest crude production base but cannot deliver more than approximately 2.4 million barrels per day of net-new crude (falling toward 2 million when SPR releases end 31 May) to the markets most exposed to the Hormuz closure — under twenty percent of the IEA’s 13 million barrel per day net market loss. The export ceiling has been pushed past its pre-crisis envelope by Suezmax and Aframax surge plus Strategic Petroleum Reserve drawdown — a temporary breach, not a structural expansion. Investors pricing the US as a credible near-term substitute for Middle Eastern supply are pricing a hypothesis the infrastructure cannot sustain. The asymmetric position is long US upstream producers with Permian light sweet exposure and tanker infrastructure and Cape-route shipping capacity, and short the energy input cost assumptions of Asian heavy-crude-import-dependent industrials. The Brent-WTI spread compression is the signal that the thesis is resolving — in either direction.
The thesis fails if the blockade does not persist. The EIA’s April 2026 Short-Term Energy Outlook explicitly treats the conflict as short-term, flagging that sustained closure would require fundamental forecast revision — a signal that the current price structure may not fully reflect a prolonged disruption. A US-Iran negotiated reopening — whether via Omani back-channel, UN Security Council intermediation, or a bilateral framework — could collapse the Brent premium and the WTI spread within days of announcement, regardless of how much physical supply has been replaced in the interim. Emergency federal permitting for offshore VLCC terminals, technically possible but requiring the suspension of standard National Environmental Policy Act review, could accelerate the 2027-2029 timeline by 12 to 18 months. These scenarios are real; they are not the base case. A blockade that survived the collapse of formal peace talks is not a dispute approaching diplomatic resolution.
Sixty-eight supertankers can load. The water’s edge cannot be crossed. The molecule follows the infrastructure, and the infrastructure runs out at the terminal gate. What the market is pricing as American energy dominance is, in physical terms, under twenty percent of the IEA’s 13 million barrel per day net market loss — delivered late, insured at 25 times the pre-crisis rate, routed 30 days the long way, to refineries that may not be configured to process it. That is not a substitute for the Strait. It is a rounding error on a crisis that has no near-term resolution.