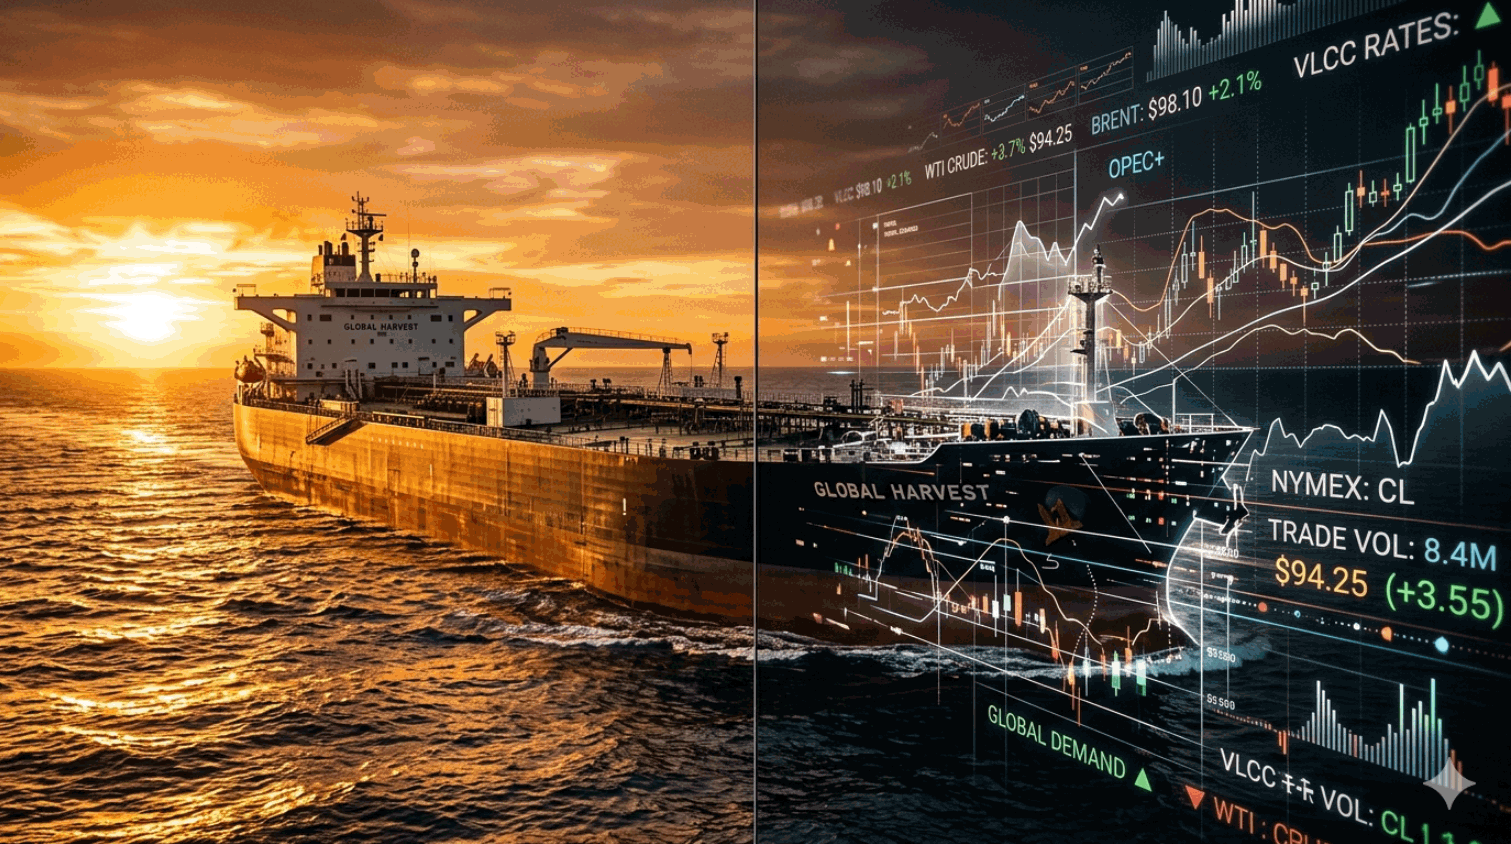
On April 7, Dated Brent — the physical benchmark compiled by S&P Global Platts from actual cargo transactions — hit $144.42 per barrel. It was the highest physical crude price since Platts began publishing the assessment in 1987, surpassing the 2008 record by twenty cents. On the same day, ICE Brent futures — the contract most fund managers, media outlets, and portfolio risk models report as “the oil price” — settled near $109. The gap between the two was thirty-five dollars. Three prices existed simultaneously on the same planet for functionally the same commodity: $78 per barrel in landlocked Kansas, $144 on the North Sea physical market, and a delivered cost of $286 per barrel for refined diesel reaching Sri Lanka.
Two weeks later, the gap has narrowed but not closed. On April 20, Dated Brent stood at $106.02 while Brent June futures traded at $94.57 — an $11.45 differential. Futures had fallen by fifteen dollars. Physical had fallen by nearly forty. The gap contracted not because paper caught up, but because physical eased from its extreme while paper drifted down on speculative positioning and ceasefire optimism. The underlying structural deficit — 10.1 million barrels per day of supply removed from the global market, the largest disruption the IEA has ever recorded — has not changed.
This note answers four questions that a reader watching the headlines has every right to ask. Why is the “oil price” falling when the physical shortage is getting worse? Why does arbitrage — the mechanism that textbooks say should close any price gap — not work? Why are equity markets at all-time highs during the largest supply disruption in history? And why does the policy, capital, and diplomatic response seem so far below the scale of the crisis?
The answer to all four is the same mechanism. The headline price — the number on the ticker, the figure in the portfolio risk model, the data point in the policy briefing — is not measuring what most people think it is measuring. It is a financial derivative, not a physical assessment. And the gap between the two is not a quirk of market structure. It is the means by which the crisis suppresses its own response.
S&P Global Platts, 7 Apr 2026
ICE, 20 Apr 2026
The implications cascade outward. When the visible price says $95 and the real price says $106 — and the delivered price in Asia says $175 — capital does not flow to alternative supply. Political urgency to resolve Hormuz dissipates. Corporations do not revise earnings guidance. Consumers do not conserve. The entire downstream response chain — from government policy to corporate investment to household behaviour — is calibrated to the wrong number.
The low price is not a signal that the crisis is manageable. It is the reason the crisis is not being managed.
The same barrel of crude oil trades at $78 in landlocked Kansas, $106 on the North Sea physical market, and reaches Sri Lanka as refined diesel at $286. The headline futures price — $94.57 — reflects none of these realities. It is a cash-settled financial contract priced inside the American domestic supply system, and it is the only number most investors ever see.
The number that scrolls across the Bloomberg terminal, appears in the Wall Street Journal headline, and drives portfolio allocation decisions at every major fund in the world is ICE Brent — a contract traded on the Intercontinental Exchange in London. It is, by a wide margin, the most liquid energy derivative on earth. And it is cash-settled. No barrel of crude oil changes hands when the contract expires. The buyer receives a payment based on the difference between the contract price and a reference index. The seller pays it. At no point does anyone need a ship, a port, an insurance policy, or a functioning strait.
WTI — West Texas Intermediate, the American benchmark — does settle with physical delivery, at Cushing, Oklahoma. This is the objection most often raised by those who argue the paper price is real. And it is technically correct. But Cushing sits inside the American domestic supply system. The United States produces 13.6 million barrels per day of its own crude. It has its own pipelines, its own refinery complex, its own strategic reserve. The WTI price reflects American domestic supply conditions — which, as traced in full in Record Producer. Structural Importer. One Export Ceiling., are physically insulated from the Hormuz disruption by an infrastructure ceiling at the water’s edge.
The physical price — what an actual refinery pays for an actual cargo of crude oil arriving at an actual port — is a different instrument entirely. S&P Global Platts compiles it daily through a structured assessment process called the Market on Close, surveying bids, offers, and confirmed trades for specific cargo windows across named crude grades. Dated Brent — the flagship physical assessment — prices cargoes loading in the North Sea within a defined forward window. It is the benchmark that refineries in Europe, Asia, and Africa use to price term contracts and spot purchases. It is the number that determines what consumers eventually pay for fuel, fertiliser feedstock, and petrochemicals. And it is largely invisible to the financial world.
“The decline in futures prices reflects the unwinding of overcrowded long positions and speculative repositioning, not a fundamental easing of the physical supply crisis.”
The divergence exists because the two instruments are measuring different things. ICE Brent measures the expected future cost of a financial settlement, weighted heavily by speculative flows, algorithmic positioning, and narrative-driven trading. Dated Brent measures the cost, today, of putting a physical barrel onto a ship and delivering it to a refinery that needs it. When the logistics system connecting the two is intact — open sea lanes, available insurance, functioning letters of credit, willing counterparties — the prices converge through arbitrage. When the logistics system breaks, they decouple. The gap between them is not a number. It is the measure of a structural fracture.

Arbitrage is the mechanism that, in a functioning market, closes any persistent price gap between two instruments pricing the same underlying commodity. When Dated Brent trades at a premium to ICE Brent futures, a trader can sell physical cargoes forward while buying futures, locking in the spread. This is not exotic finance. It is the foundational act of commodity trading, and it works reliably — provided five conditions hold simultaneously. Since late February 2026, all five have been broken at once.
Open Routes. The Strait of Hormuz carried approximately 20 million barrels per day before the conflict began. In March 2026, actual transits collapsed to 5.7 ships per day — a 94.6% decline from the pre-war average of over 100 daily transits, as documented in Completely Open. Completely Conditional. Nine Days. The physical route through which the majority of the world’s seaborne crude moves is, for practical purposes, closed. The ceasefire that began April 8 has not changed the throughput. No major shipping line has resumed Gulf loading operations, and the IRGC permission corridor — a narrow lane under military escort — permits at most 20–24 transits per day under optimistic assumptions.
Insurance. War risk premiums across the Persian Gulf have been repriced to levels that make most voyages uneconomical for any cargo not commanding an extreme physical premium. Lloyd’s of London and its syndicates have designated the entire Gulf a high-risk zone. The additional premium — layered on top of standard hull, cargo, and P&I coverage — now exceeds the profit margin on a standard crude cargo at pre-crisis freight rates. A trader cannot arbitrage the spread if the cost of insuring the voyage exceeds the spread itself.
Financing. International crude trade operates on letters of credit — bank guarantees that the buyer will pay upon confirmed delivery. When the delivery route is uncertain, the insurance unavailable, and the destination port itself facing force majeure, banks withdraw the credit facility. The letter of credit is not a formality. It is the financial bridge that lets a cargo worth $150 million change hands between counterparties who may never have met. Without it, the trade does not execute.
Logistics. Even if a vessel could transit Hormuz, 230 loaded tankers remain stranded inside the Persian Gulf as of mid-April, unable to access their intended discharge ports or reroute to alternatives without canal, port, and receiving infrastructure that is either full or repriced. Freight rates have surged from approximately $1 per barrel to $25 per barrel at peak. VLCCs — the supertankers that carry two million barrels each — rerouting via the Cape of Good Hope add 10–14 days per voyage. The logistics chain is not slow. It is severed.
Counterparties. QatarEnergy has declared force majeure — a legal suspension of contractual obligations due to circumstances beyond its control — on LNG contracts to China, Italy, Belgium, and South Korea. Saudi Aramco is running the East-West Pipeline at maximum capacity and has no uncommitted spot barrels. Abu Dhabi is loading at near-maximum through the ADCOP pipeline to Fujairah. The sellers who would normally offer physical cargoes into the arbitrage have either been force-majeured out of the market or are fully committed to term buyers. There is no available barrel for the arbitrageur to buy.
All five conditions required for commodity arbitrage have been broken simultaneously since late February 2026. This is not a partial disruption or a basis-trade inconvenience. It is a structural disconnection between the financial price and the physical price with no self-correcting mechanism until at least one condition is restored.
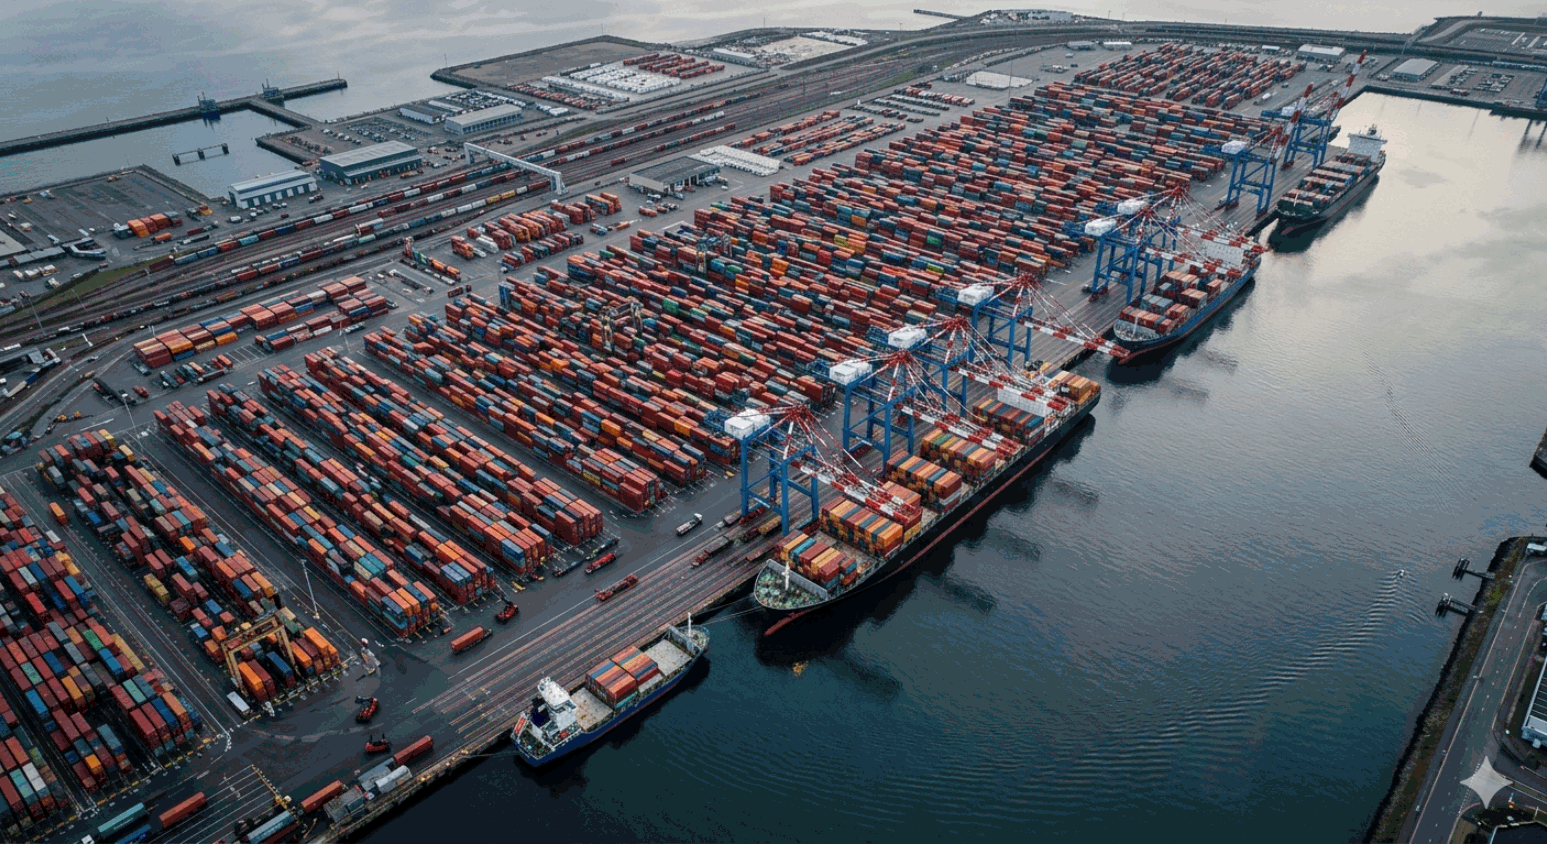
The global logistics system has not stood still since the strait closed. In four weeks, 34,000 commercial ships were rerouted around or away from the conflict zone. Average daily ocean freight diversions surged 360%, from 218 to over 1,010 per day. India’s Jawaharlal Nehru Port Trust saw container volumes rise 700% against the February baseline. Maersk issued five operational updates in two weeks, building an entirely new container routing map. The system adapted. It found workarounds. It moved cargo.
The workaround runs through the UAE. Containerised goods arrive at Khor Fakkan, on the Gulf of Oman coast, bypassing Hormuz entirely. From there, they are trucked through Oman to the ports of Sohar and Salalah on the Arabian Sea. At Salalah, they are loaded onto feeder vessels bound for Jeddah on the Red Sea, where they reconnect with the global east-west shipping lanes. The route is slower. It is more expensive. But it works, because a container is 20 feet long, weighs up to 30 tonnes, and fits on a truck.
FreightWaves, Apr 2026
Via Alternative Route
A barrel of crude oil does not fit on a truck. Or rather, it does — but the global oil market moves 100 million barrels per day, and the volumes trapped behind Hormuz represent approximately 15 million barrels per day of crude and products. The Saudi East-West Pipeline — the only large-scale bypass running from the Gulf coast to the Red Sea — hit its maximum 7 million barrels per day in late March. The Abu Dhabi Crude Oil Pipeline carries 1.5 million barrels per day to the port of Fujairah on the Gulf of Oman, bypassing the strait entirely. Combined, they move 8.5 million barrels per day — roughly 40% of the pre-war Hormuz throughput. The remaining 11.5 million barrels per day have no alternative route. There is no trucking workaround for crude at this scale. There is no container solution. The barrel is trapped.
“Hormuz is not open. There are 230 loaded tankers inside the Gulf waiting to leave. There are 20,000 mariners and 2,000 ships effectively stranded. This is not a theoretical risk. It is a daily operational reality.”
This is the distinction the headline price cannot capture. The containerised global economy — consumer goods, electronics, manufactured products — found its detour in days. The molecular economy — crude oil, LNG, petrochemical feedstocks — has no detour to find. The container adapts. The molecule waits. And while it waits, the cumulative deficit grows. HFI Research estimates the cumulative barrel loss at approximately 1.2 billion barrels by end of April, rising to 1.98 billion by end of June — four times larger than any supply outage in history. Each month adds roughly 330 million barrels to the deficit. The number does not plateau. It compounds.
Asian refiners outside Japan and China will exhaust their inventory cushion by the first week of May. European supply strain is anticipated by early May. The cumulative deficit is not a projection. It is running arithmetic on confirmed shut-in volumes. The deficit does not wait for diplomacy.

The oil price is not the only instrument sending a false signal. On April 19, the S&P 500 closed at 7,109 — an all-time high. The Nasdaq was on its longest winning streak since 1992. The VIX — the market’s standard measure of expected volatility — sat at 18.85. By any standard reading of these indicators, the American equity market was pricing a world in which the largest oil supply disruption in history was either resolved, contained, or irrelevant.
19 Apr 2026
21 Apr 2026
The market has a name for this trade. Investors call it TACO — Trump Always Chickens Out — the bet that any geopolitical escalation involving the current administration will be walked back before it reaches the point of sustained economic damage. The ceasefire on April 8 reinforced the thesis. Futures dropped. Equities rallied. The VIX barely moved. The logic is internally consistent: if the conflict resolves quickly, tech earnings are untouched, consumer spending holds, and the energy spike is transient. The problem is that the physical market has already answered the question the equity market is still deferring.
Deutsche Bank has flagged the pattern as 2022-style misplaced optimism, where markets priced peace months before conditions warranted it. BCA Research notes the market is “struggling to price whipsaw Hormuz news.” LSEG has warned explicitly about the risk of mispricing — oil’s big jump versus the market’s small reaction. The TACO trade is not free. The premium for being wrong is measured in quarters, not days.
The insulation is real but temporary. Technology stocks comprise roughly half the S&P 500 by market capitalisation. Their direct exposure to energy costs is minimal. No semiconductor fabricator buys Dated Brent. No cloud infrastructure company hedges Hormuz risk. In the near term, the index masks the damage behind its own composition. But the transmission is already running. Airlines have repriced fuel surcharges. Shipping companies have revised route economics. Chemical producers have flagged feedstock constraints. Barron’s reports that companies across energy-exposed sectors are baking “higher for longer” energy costs into forward guidance. The question is not whether the transmission reaches the equity market. It is when.
The answer is Q2 earnings, which report in July. That is when the income statements of airlines, shipping firms, chemical companies, agricultural processors, and consumer-facing businesses will reflect the cost of crude at physical-market prices — not the headline futures price their risk models assumed. Goldman Sachs has noted that a sustained disruption could materially drag S&P 500 aggregate earnings. The Stimson Center’s analysis is blunter: the economic shock will snap back even if fighting stops today, because the physical deficit has already been running for two months and the repair timeline extends well beyond any diplomatic calendar.
This is the broader anaesthetic. The oil price says $95. The equity market says 7,109. The VIX says 19. Together, they compose a picture of an economy absorbing a crisis. The physical market — where the barrels are, where they are not, what it costs to move them, how long until the deficit becomes visible in consumer prices and corporate margins — tells a different story. The IMF has already cut its 2026 global growth forecast to 3.1% from 3.3%, citing energy disruption and headline inflation projected at 4.4%. US gasoline prices have risen by $1 per gallon in seven weeks. The anaesthetic is wearing off from the bottom up. The question is whether it wears off at the top — in equity prices and policy response — before the structural damage becomes irreversible.

The investor who distinguishes between paper energy prices and physical energy prices is better positioned than the investor who does not. Broad energy equities — producers, midstream operators, and select oilfield services firms — are priced against futures-derived revenue expectations, not against the physical premium their barrels actually command. Physical commodity exposure, where accessible through delivery-based contracts or equity in companies with direct physical marketing operations, captures a premium that paper-only exposure misses entirely. On the other side, equities with embedded energy-cost assumptions built on headline futures — airlines, container shipping, chemical producers, and food processors — carry unpriced risk that will surface in Q2 and Q3 earnings cycles. The risk is asymmetric: the downside from being wrong about convergence timing is a missed quarter; the downside from being wrong about convergence direction is a repricing of every energy-cost assumption in every DCF model in every sector that touches a molecule.
The paper-physical oil price gap is not a market inefficiency waiting to be arbitraged. It is a structural disconnection driven by the simultaneous failure of every mechanism that normally links financial prices to physical reality. Convergence is inevitable — paper will catch up to physical, not the other way around — because the deficit is cumulative and the buffer is finite. The question is not whether the reckoning arrives. It is whether capital is positioned on the right side of it when it does. Every month of delay adds approximately 330 million barrels to the cumulative deficit, making the eventual price adjustment steeper, not shallower. The investor who waits for the futures price to confirm what the physical price is already screaming will be positioned correctly — but late, and at a worse entry.
The thesis is wrong if Hormuz reopens fully and sustainably within weeks — not the conditional IRGC corridor, but the pre-war Traffic Separation Scheme carrying 100-plus transits per day — and the 230 stranded tankers begin offloading simultaneously while OPEC production normalises on a timeline materially faster than the nine-month estimate. Even in this scenario, the cumulative deficit already banked through April and May does not disappear; it must be worked off through above-trend production for months. The thesis is also wrong if demand destruction reaches a scale sufficient to eliminate the need for the missing barrels entirely — a scenario that implies a global recession deeper than anything currently forecast by the IMF, the OECD, or any major investment bank. Neither scenario is impossible. Neither is the base case. The base case is that convergence arrives on the physical market’s timeline, not on the timeline the futures price is currently implying.
The headline oil price is the most consequential false signal in global markets today. It is calibrated to a financial contract settled in cash inside a domestic supply system that does not face the crisis. It is suppressing the capital allocation, the policy response, and the conservation behaviour that would mitigate the structural deficit. When it catches up — and the arithmetic says it will — the adjustment will be sharper for having been delayed. The reckoning is not a risk. It is a schedule.