The RecessionALERT Valuation Index (RAVI) is a multifactor valuation model that examines cyclically adjusted trailing SP-500 earnings (various multi-decade horizons), the SP-500 total-return index level, total stock market capitalization, Gross Domestic Product, non-financial corporate equities and liabilities, non-financial corporate business net-worth and percentage of investors’ allocation to stocks versus cash and bonds to determine 10, 5, 3, 2 and 1 year forecasts for the SP-500 Total Return Index (dividends re-invested). The in-sample accuracy of the various forecast horizons since 1970 are shown below:
The RAVI model is updated quarterly and lags by one quarter. The data for the 3rd quarter of 2014 (as at end of September) was released on 17 December 2014. Let us examine what it is telling us about ^SPXTR (SP500 Total Return Index) returns across the various forecast horizons:
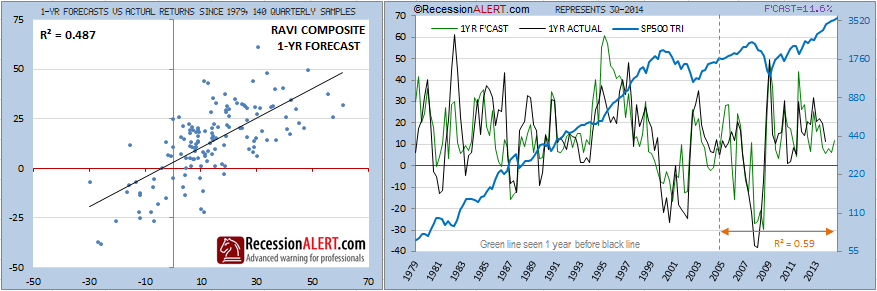
The 1-year (4 quarter) forecast appears below. The first chart on the left shows the accuracy of the RAVI model since 1979 with the x-axis representing the model forecast and the y-axis representing the actual achieved ^SPXTR 1-year returns from the forecast date. An r-squared of 0.487 might not appear much to sniff at, but considering the short forecast horizon, it is actually somewhat astonishing as far as forecasting models go. In fact, the r-squared correlation over the last 9 years since 2005 has actually tightened to 0.59. The model is forecasting returns of 11.6% from October 2014 through to October 2015. Given that ^SPXTR has already risen 6.4% since 1 October 2014, this leaves 4.89% gain potential for the next 10.5 months from 17 Dec 2014 or roughly 5.62% compound growth rate.
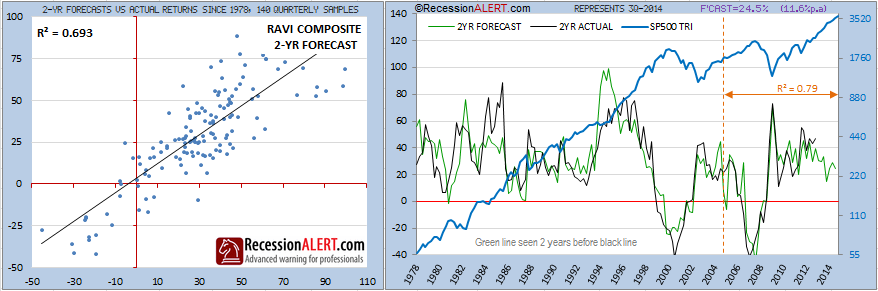
The 2-year (8 quarter) forecast appears below. The first chart on the left shows the accuracy of the RAVI model since 1978 with the x-axis representing the model forecast and the y-axis representing the actual achieved ^SPXTR 2-year returns from the forecast date. The longer horizon yields a much higher correlation as is to be expected. An r-squared of 0.69 might not appear much, but considering the short forecast horizon, it is actually respectable as far as forecasting models go. In fact, the r-squared correlation over the last 9 years since 2005 has actually tightened to a respectable 0.79. The model is forecasting returns of 24.5% from October 2014 through to October 2016 which equates to 11.6% compound growth per annum which dovetails nicely with the 1-year forecast. Given that ^SPXTR has already risen 6.4% since 1 October 2014, this leaves 17.01% gain potential for the next 22.5 months from 17 Dec 2014, or roughly 8.76% compound growth rate.
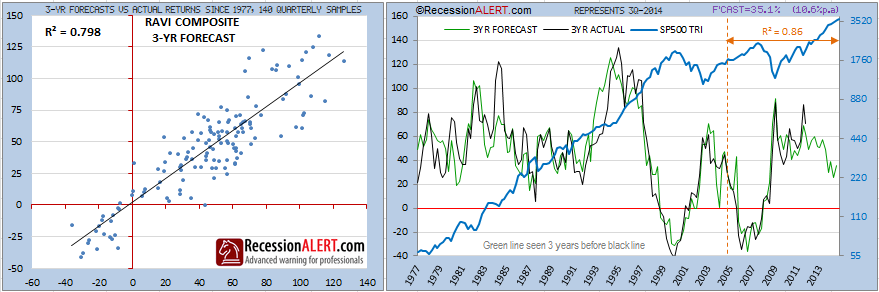
The 3-year (12 quarter) forecast appears below. The first chart on the left shows the accuracy of the RAVI model since 1977 with the x-axis representing the model forecast and the y-axis representing the actual achieved ^SPXTR 3-year returns from the forecast date. The longer horizon yields a much higher correlation as is to be expected. An r-squared of 0.79 is respectable considering the short forecast horizon, and the correlation has actually improved to 0.86 over the last 9 years since 2005. The model is forecasting returns of 35.1% from October 2014 through to October 2017 which equates to 10.6% compound growth per annum. Given that ^SPXTR has already risen 6.4% since 1 October 2014, this leaves 26.97% gain potential for the next 34.5 months from 17 Dec 2014, or roughly 8.66% compound growth rate – very close to the 2-year forecast:
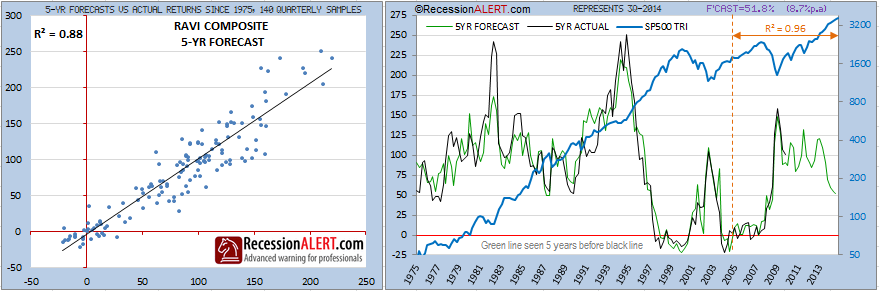
The 5-year (20 quarter) forecast appears below. The first chart on the left shows the accuracy of the RAVI model since 1975 with the x-axis representing the model forecast and the y-axis representing the actual achieved ^SPXTR 5-year returns from the forecast date. The longer horizon yields a much higher correlation as is to be expected. An r-squared of 0.88 is pretty respectable considering the short forecast horizon, and the correlation has actually improved to an astonishing 0.96 over the last 9 years since 2005. The model is forecasting returns of 51.8% from October 2014 through to October 2019 which equates to 8.7% compound growth per annum. Given that ^SPXTR has already risen 6.4% since 1 October 2014, this leaves 42.7% gain potential for the next 58.5 months from 17 Dec 2014, or roughly 7.56% compound growth rate:
If we average the compound growth rate forecasts from the 2,3 and 5-year forecasting models, we get an expected annual growth rate of 8.33% for ^SPXTR. We can apply this growth rate to the next 12.5 months taking us to the end of 2015 to arrive at an estimate of 8.67% growth for the SP-500 or a target of 2,246 by the end of 2015 (assuming of course that the SP-500 grows at roughly the same rate as the ^SPXTR over the next year). This lines up in the middle of existing targets that have been thrown out in the blogosphere ranging from 2,100 to 2,350. Of course, as each quarter progresses we will get more refined/updated information to provide even higher accuracy targets for 2015.
THE BELOW CONTENT IS COPYRIGHTED. ARTICLE RE-POSTS MUST LINK TO THIS PAGE TO ALLOW YOUR READERS TO COMPLETE THE ARTICLE.
Bear-market and Recession Indicator
There is an interesting “by-product” of the RAVI as a bear-market and U.S recession indicator. Since the 1-year forecast “looks ahead” 4 quarters, we can average it by 4 quarters to attempt to obtain a “co-incident” view which warns of bear markets upon dipping below zero. We apply the same logic to the 8-quarter average of the 2-year forecast and the 12-quarter average of the 3-year forecast. Indeed, they all provide similar co-incident warnings of stock market corrections and 2-3 quarter warnings to recessions as displayed below. It is interesting to note that the rise of these “smoothed” indicators above zero also provide for good stock market re-entry signals:
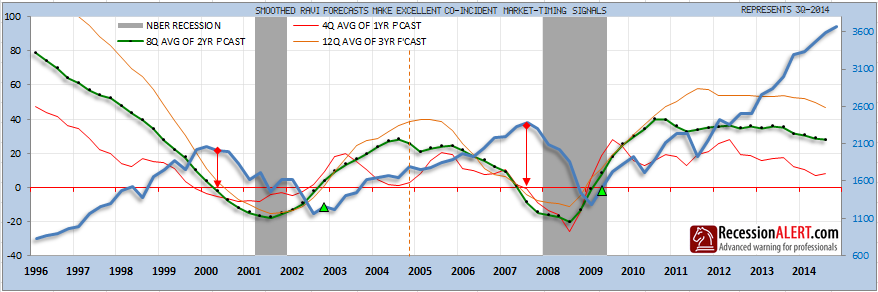
It is intriguing that a valuation model can serve as stock market timing signal or recession indicator so this is certainly one new tool our clients will be monitoring closely going forward. It would be unwise to rely entirely upon this mechanism to attempt to gauge stock market risk and we recommend using it together with our existing Composite Market Health Index (CMHI) in the foreseeable future.Whilst the smoothed forecasts that produce these signals have been weakening over the last few quarters and are no “pillars of strength” right now, they are not warning of any stock market corrections on the immediate horizon. In other words, the stock market is a lot less over-valued than you would think.
You should need no reminding that these are forecasts based on models utilising in-sample data and whilst our own research of the efficacy of the methodology in both robust in-sample and out-of-sample testing is highly encouraging, we should always bear in mind black-swans and geo-political events can always throw a spanner in the works and remind us that past performance is no guarantee for future returns. Also, shorter term forecasting is subject to more quarter-to-quarter variance than longer-term forecasting, despite perceived long-term correlation levels. This is especially the case when dealing with single-digit growth forecasts in above-average valuation scenarios such as we find ourselves in now when a 2-3% variance from expected outcomes actually makes a large difference. At the very least though, you can make estimates with some sound statistical reasoning behind them, since at the end of the day one always needs to be dealing with calculated risks in investing.
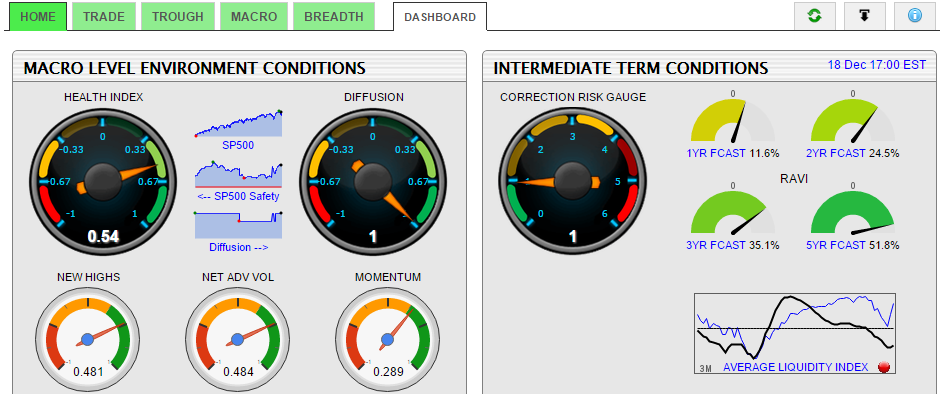
RecessionALERT subscribers can obtain quarterly updates of all the above charts in the CHARTS>MACRO>RAVI menu tab. The next quarterly update representing 4Q2014 is on 17 March 2015 and will be followed by a repeat of this analysis for subscribers. The 1,2,3 and 5-year forecasts also appear on the charts HOME tab, to the top-right of the right-hand panel: